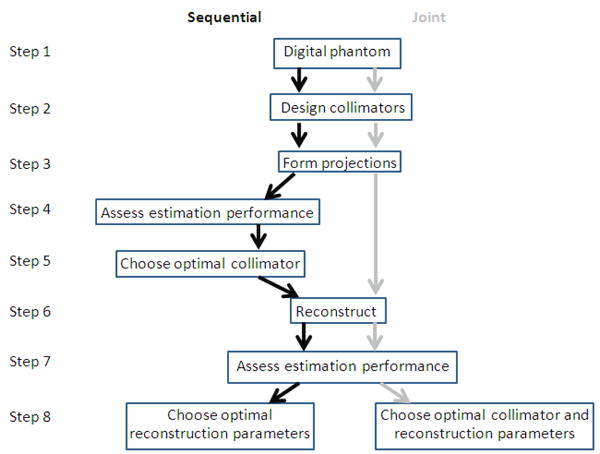
Figure 3.

The stages involved in the sequential- and joint-optimization methods. The black arrows on the left indicate the steps involved in sequential optimization and the grey arrows on the right are those involved in the joint optimization. Both methods were evaluated for digital phantoms with uniform and lumpy backgrounds.
