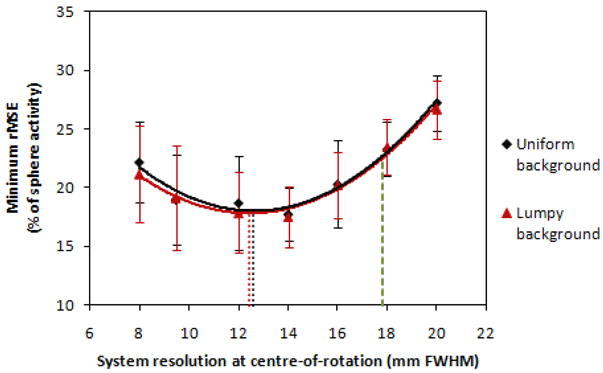
Figure 6.

The minimum rMSE (after selecting the optimal post-reconstruction smoothing for each collimator) for sphere activity concentration estimation as a function of system resolution at the centre-of-rotation, using an SUV-type metric. Both curves are 2nd order polynomial fits, the minima of which are shown as dotted lines. The best result obtainable using the sequentially optimized collimator is indicated by a dashed line at a system resolution of 17.8 mm.
