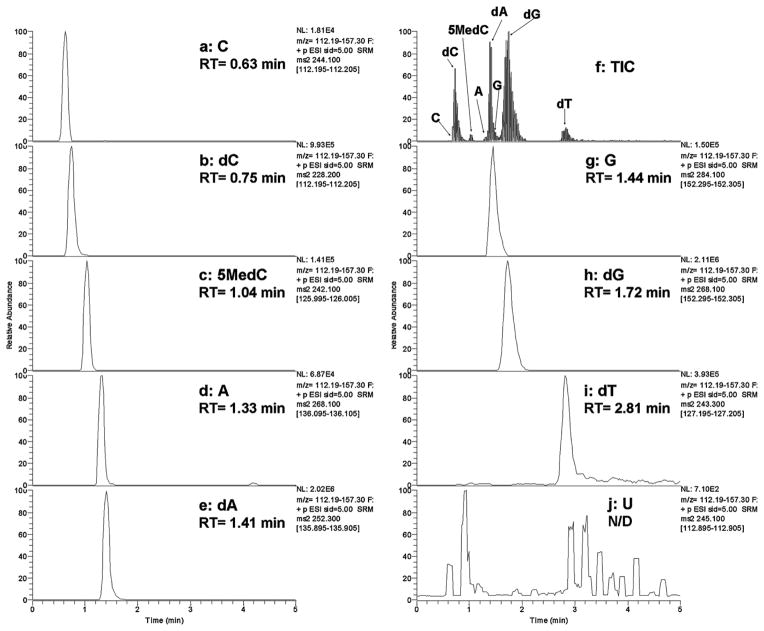
Fig. 2.
Typical LCMS chromatogram of QC DNA hydrolysates showing separation of cytidine (a), dC (b), 5MedC (c), adenosine (d), dA (e), total ion current (f), guanosine (g), dG (h), 2-deoxythymidine (i), and uridine (j) with a TSQ Quantum Ultra triple-quadrupole mass spectrometer. Numbers give retention times in minutes. Uridine was not detected in the analysis timeframe between 0 and 5 min (signals shown are of very low intensity and show as large peaks due to the >500-fold magnified scale relative to other panels).

