
Figure 2. Clec16a KD causes T cell hyporeactivity.
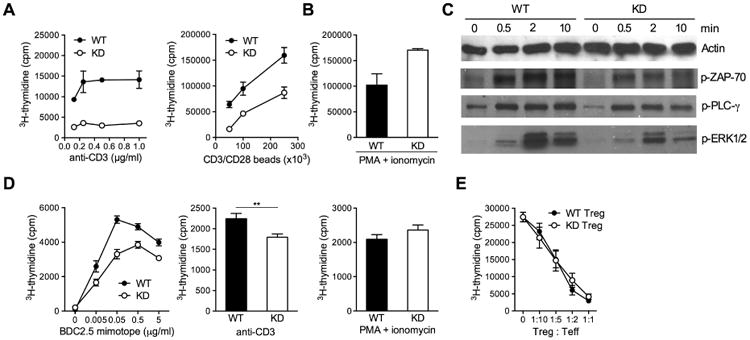
(A, B) Proliferation of CD4 T cells in response to CD3 antibody (A, left panel), CD3/CD28 antibody-coated beads (A, right panel) or PMA and ionomycin (B). (C) Western blot measurements of ZAP-70, PLC-γ and ERK1/2 phosphorylation in WT or KD CD4 T cells stimulated with cross-linked CD3 antibody for the indicated length of time (in min). (D) Proliferation of WT or KD TCR transgenic BDC2.5 CD4 T cells in response to BDC2.5 mimotope peptide (left panel), CD3 antibody (1 μg/ml, middle panel) or PMA and ionomycin (right panel). (E) Suppression of WT CD4 T cell proliferation by WT or KD CD4+CD25+ Treg cells. Results show mean ± SEM of triplicate measurements and are representative of 2 to 4 experiments. ** P < 0.01
See also Figure S2.