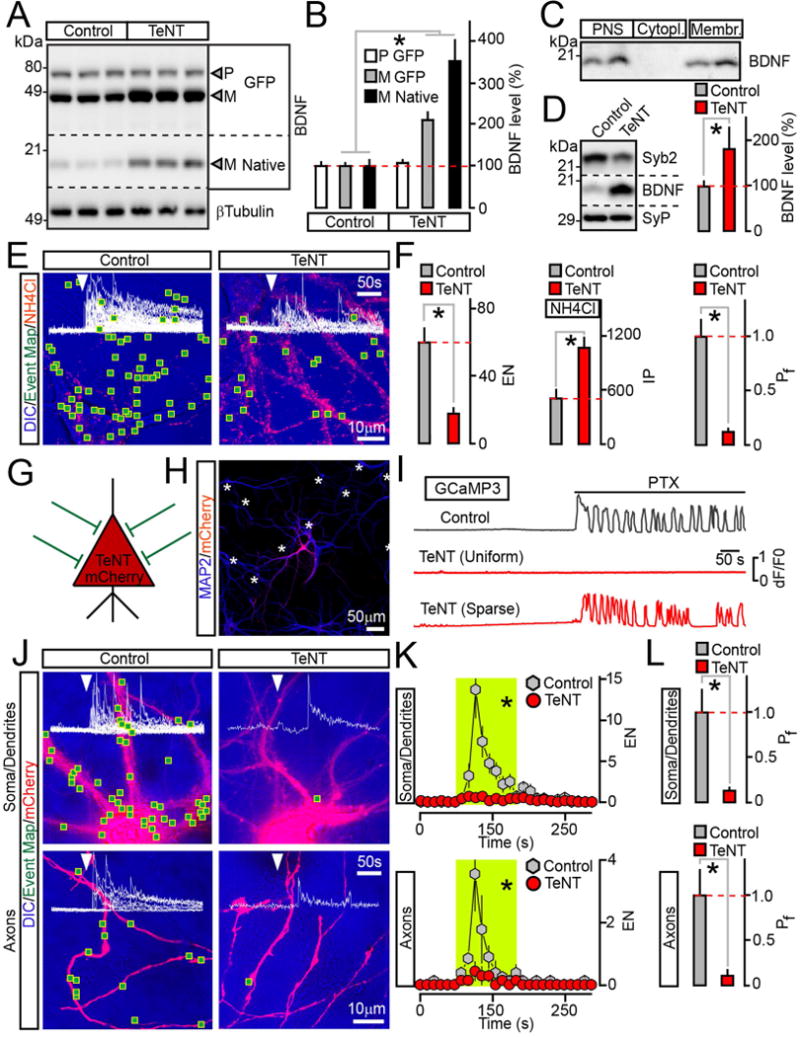
Figure 2. Analysis of BDNF release in neurons carrying TeNT.

(A and B) Measurements of pro (P) and mature (M) BDNF levels in cultured neurons that uniformly expressed BDNF-pHluorin alone (Control) or with TeNT. Quantitative immunoblotting was performed with an antibody to BDNF which recognizes all native and recombinant forms. βTubulin was used as a loading standard. Representative blots and averaged values from 3 experiments are shown.
(C) Subcellular fractions of mouse forebrains were isolated by differential centrifugation and probed by immunoblotting for native BDNF. PNS=post nuclear supernatant.
(D) Quantitative immunoblot measurements of mature BDNF levels in membrane fractions prepared from cortices of wildtype P15 mice (Control) and their littermates carrying TeNT in glutamatergic neurons (CamKIIα:Cre/R26floxstopTeNT). n = 5 mice/genotype. The reduction of Syb2 band intensity is due to cleavage by TeNT, which makes Syb2 undetectable with antibodies.
(E and F) TIRF microscopy analysis of vesicle exocytosis in DIV15 cultured neurons that globally expressed BDNF-pHluorin without or with TeNT. (E) Pseudo-colored DIC images with superimposed maps of all sites where vesicle fusion was detected during transient depolarization with KCl (2 minutes). Red puncta are intracellular reporter-positive vesicles visualized by perfusing 50 mM of NH4Cl following stimulation. (F) Averaged EN (calculated for a 2 minute window of stimulation in entire fields of view), IP and Pf. n = 9/group.
(G to L) Cell-autonomous effects of TeNT on BDNF release. Neurons were sparsely infected (~5% of the total population) with lentiviruses encoding BDNF-pHluorin and mCherry alone or together with TeNT. These cells received synaptic inputs from wildtype neurons, as depicted in panel (G). (H) An example of infection pattern. Cultures were stained for MAP2. Asterisks label somas of reporter-negative cells. (I) PTX-induced (100 μM) calcium signals were recorded from neurons co-expressing TeNT, mCherry and GCaMP3 either globally or sparsely, as described above. (J to L) Exocytosis of BDNF vesicles was monitored by TIRF microscopy at DIV15. (J) DIC and mCherry images with mapped regions of somato-dendritic and axonal domains where vesicle fusion was observed during 2 minute depolarization with KCl. Superimposed traces of BDNF-pHluorin fluorescence sampled in time-lapse mode (inserts, arrows mark times of excitation) reflect exocytosis in each site. (K) Averaged EN in different subcellular compartments of individual neurons, plotted as a function of time (10 second bin). Green boxes mark the window of transient excitation. (L) Mean Pf of evoked fusion in somas, dendrites and axons. n = 7–8/group.
Quantifications are represented as Mean ± S.E.M. n corresponds to numbers of trials performed with at least 3 independent culture preparations. * p < 0.001 (t-test).
