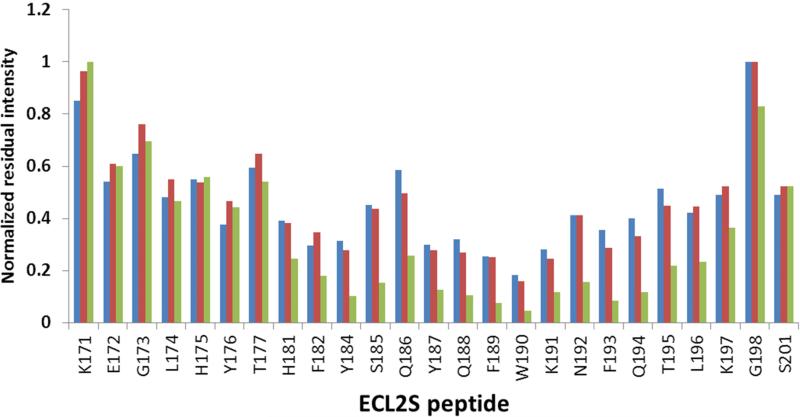
Fig. 4.
Dynamic-filtering mapping of the ECL2S determinant interacting with gp120 at neutral pH. Plot of the intensities of the 1H-15N HSQC cross peaks in the presence of a 1:1 molar ratio of the different proteins divided by the intensity of the corresponding cross peak of the free ECL2S peptide obtained at the same peptide concentration. Intensity ratios are shown for ECL2S cross peaks after titration with a 1:1 molar ratio of BSA (blue), mutgp120core(+V3)/CD4M33 (red) or mutgp120core/CD4M33 (green). The intensities ratios were normalized against the residue exhibiting the lowest reduction in intensity (G198 or K191) upon protein binding. The HSQC spectra were recorded at pH 7 and 15° C. The estimated error in these measurements is ± 15%.

