
Figure 4.
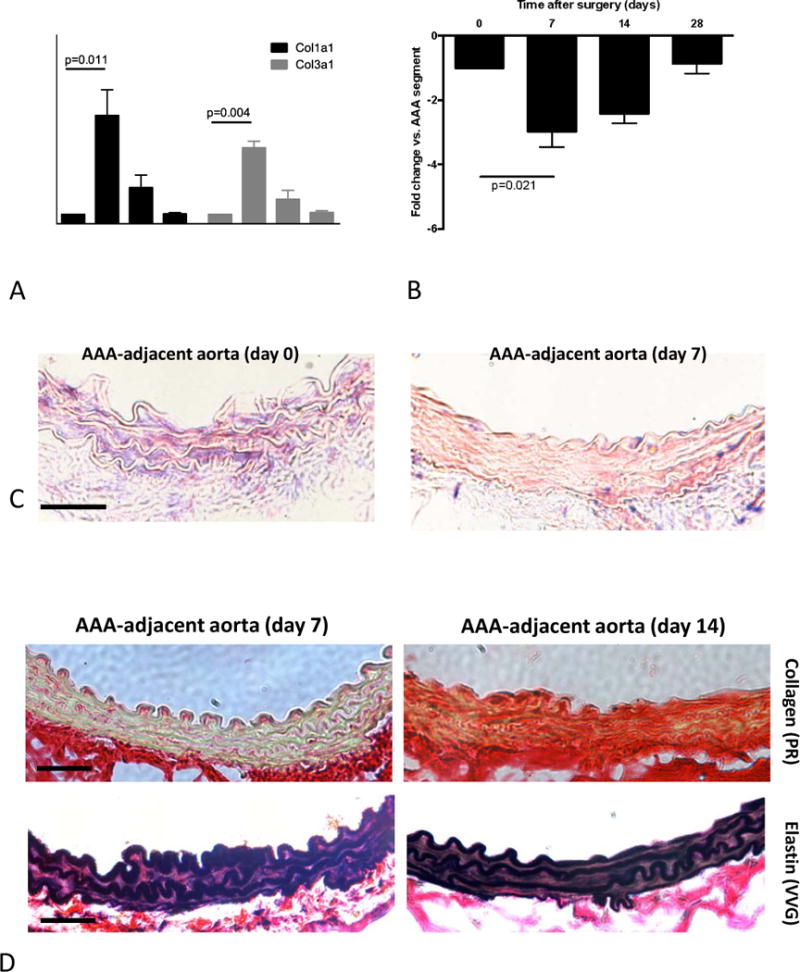
Stiffening mechanisms of the AAA-adjacent aorta. (A) Temporal analysis of the Col1a1 and Col3a1 gene expression in the AAA-adjacent aorta compared to the AAA (PPE-treated) segment. (B) Temporal analysis of miR-29b expression in the AAA-adjacent aorta compared to the AAA (PPE-treated) segment. (C) in situ hybridization for miR-29b (purple-blue dye) and red nuclear counterstain in the AAA-adjacent aortic segments (original magnification 400×, scale bar 50 μm) (D) Representative images of the aortic wall taken from AAA-adjacent aortic segments 7 days or 14 days after PPE-treatment stained with Picrosirius Red (upper panels; red: collagen; yellow: muscle) and Elastin VVG staining (lower panels). Original magnification 400×, scale bar 50 μm. * indicates p<0.05 vs. all other time points; # indicates p<0.05 vs. d0 and d28. n=5 for each time point; p values denote differences between expression levels by Kruskal-Wallis test with Dunn’s post test.