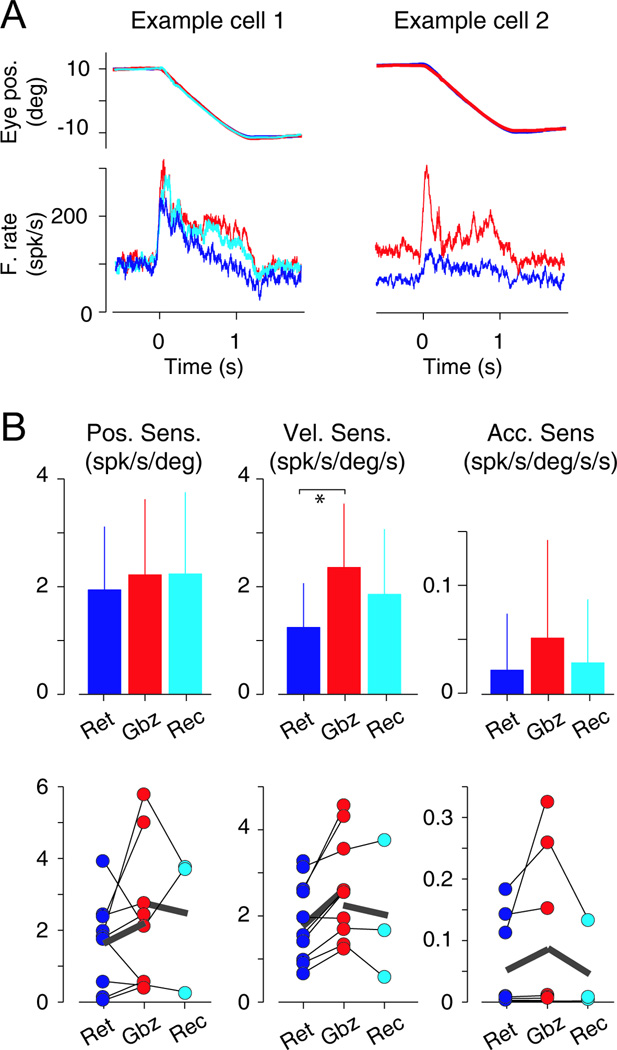
Figure 4. Response of VPFL PCs during step ramp pursuit with and without gabazine application.
(A) Response of two example VPFL PCs recorded before (blue), during (red) and after (cyan in example cell 1) gabazine application. Top traces show the behavioral responses (deg) and bottom traces the neuronal responses (spk/s).
(B) Top panels show bar graphs illustrating the changes in eye position, velocity, and acceleration sensitivity of the population data (left, center and right, respectively). Bottom panels show data from individual cells. Retention (blue, Ret), injection (red, Gbz) and recovery (cyan, Rec) periods are shown. Thin black lines join data collected from the same neuron, and think gray lines show the average from the corresponding neurons. Asterisk indicates significance (* 0.05<p<0.01).
See also Figure S6.

