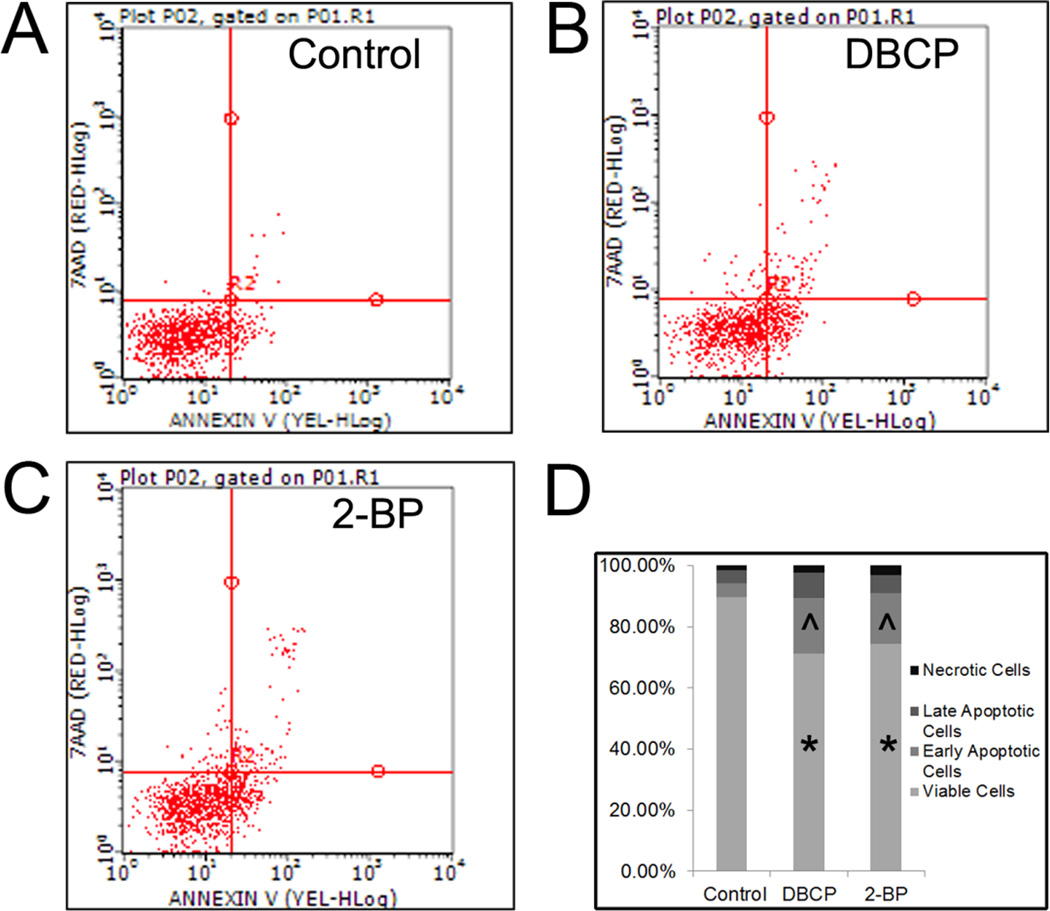
Figure 2. Annexin V analyses demonstrate that 2-BP and DBCP induce apoptosis in spermatogenic cells derived from hESCs.
Flow cytometry analyses indicating percent viable cells, percent early apoptotic cells, percent late apoptotic cells, and percent necrotic cells. Samples from three experiments for each condition were pooled and then 10,000 events were analyzed. (A) Vehicle control cells, (B) DBCP-treated cells, and (C) 2-BP-treated cells. Scatter plots for cell populations are shown. Lower left quadrant represents viable cells, lower right quadrant represents early apoptotic cells, upper right is late apoptotic, and upper left is necrotic. (D) Graphical summary of data collected in stacked graphs showing average percentages of cells in each population. * represents p < 0.01 statistical significance for decreased % of viable cells in DBCP and 2-BP treatments, ^ represents p < 0.01 statistical significance for increased % of early apoptotic cells in DBCP and 2-BP treatments.

