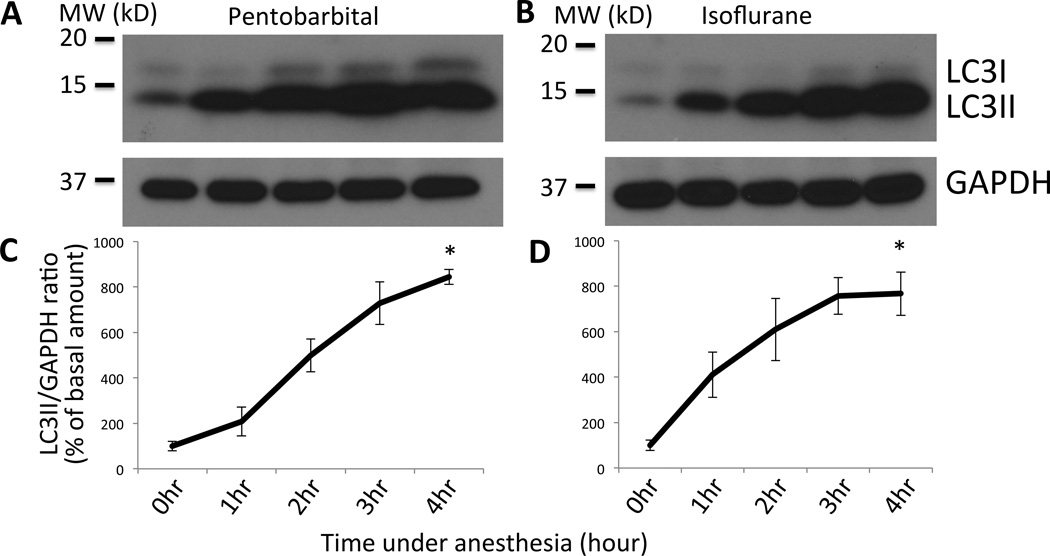
Figure 3. Western blot of LC3 shows upregulation of autophagy in a time-dependent manner after anesthesia.
(A&B) Tibialis anterior muscles were harvested from wild type mice at different time points (0 – 4 h) after anesthesia with pentobarbital (A) or isoflurane (B), homogenized, separated by SDS-polyacrylamide gel electrophoresis, and blotted with anti-LC3 antibody. Increased LC3II was observed after pentobarbital injection. Loading control with GAPDH blotting is shown in the bottom panel. Bars to the left of the figure represent the molecular weightin kilodalton (‘MW (kD)’). (C&D) Densitometry of each band was performed and the ratio of LC3II/GAPDH was calculated for samples with anesthesia by pentobarbital (C) or isoflurane (D). Relative ratio of LCII/GAPDH as compared to the basal value at time 0 was plotted in percentage with the standard error. *p<0.05 by Friedman’s nonparametric test with Dunn’s post-hoc analysis (n=3). With ANOVA and Dunnett’s multiple comparison test, p<0.05 at 2 h and p<0.01 at 3 and 4 h for pentobarbital, p<0.01 after 2 h for isoflurane. The labeling for the time course of each time point in the lower panels (C&D) corresponds to each lane of the upper gel figures (A&B). GAPDH = Glyceraldehyde 3-phosphate dehydrogenase.

