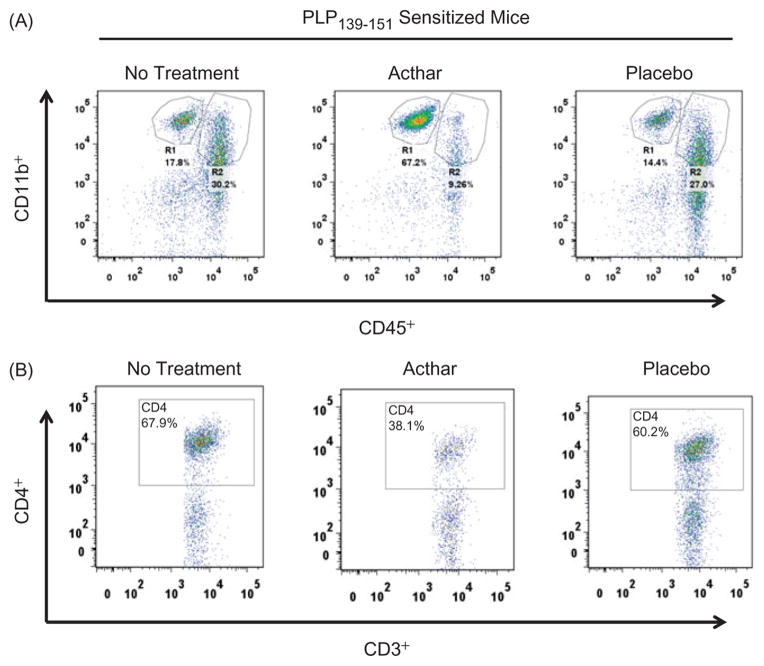
Figure 6.
Representative flow cytometric plots of cells isolated from the spinal cords of EAE mice euthanized 5 days after onset of treatment. (A) Macrophages (R2) are markedly lower in Acthar-treated mice in comparison to no treatment and Placebo gel-treated mice. R region. (B) Frequency of T cells (CD45+ CD3+ CD4+) is markedly lower in Acthar-treated mice. Quantification of flow cytometric data is shown in Table 3.

