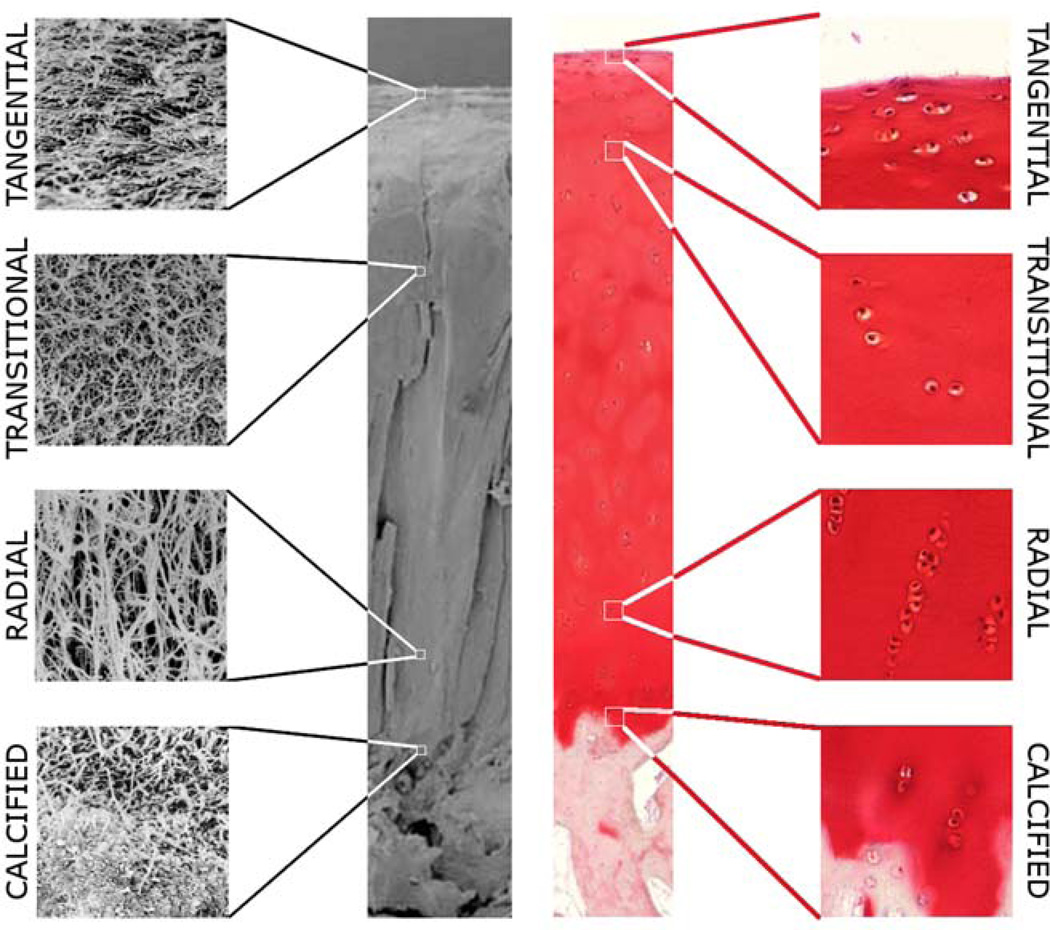
Figure 1.
Example of cartilage composition and structure in intact cartilage. Left side: Scanning electron microscopy (full view) and 6000× magnification fields of the collagen network showing the arrangement of collagen fibrils. The tangential zone shows thin collagen fibrils arranged parallel to the articular surface. The transitional zone presents random arrangement of slightly thicker collagen fibrils, while the radial zone contains thick collagen fibrils running perpendicular to the bone cartilage interface. The calcified zone shows the transition between the radial zone and the subchondral bone. Right side: Safranin-O stained of histology slide and 100× magnification showing chondrocytes. The intensity of the stain is estequiometric with the concentration of glycosaminoglycans in the cartilage matrix. Observe the increase in staining intensity from the articular surface to the calcified zone. The distribution of glycosaminoglycans provides an optimal gradient of osmotic pressure in the cartilage. The tangential zone is characterized by isolated ellipsoidal chondrocytes. In the transitional zone chondrocytes are still isolated but present a spherical shape. Chondrocytes in the radial zone piled up in columns.

