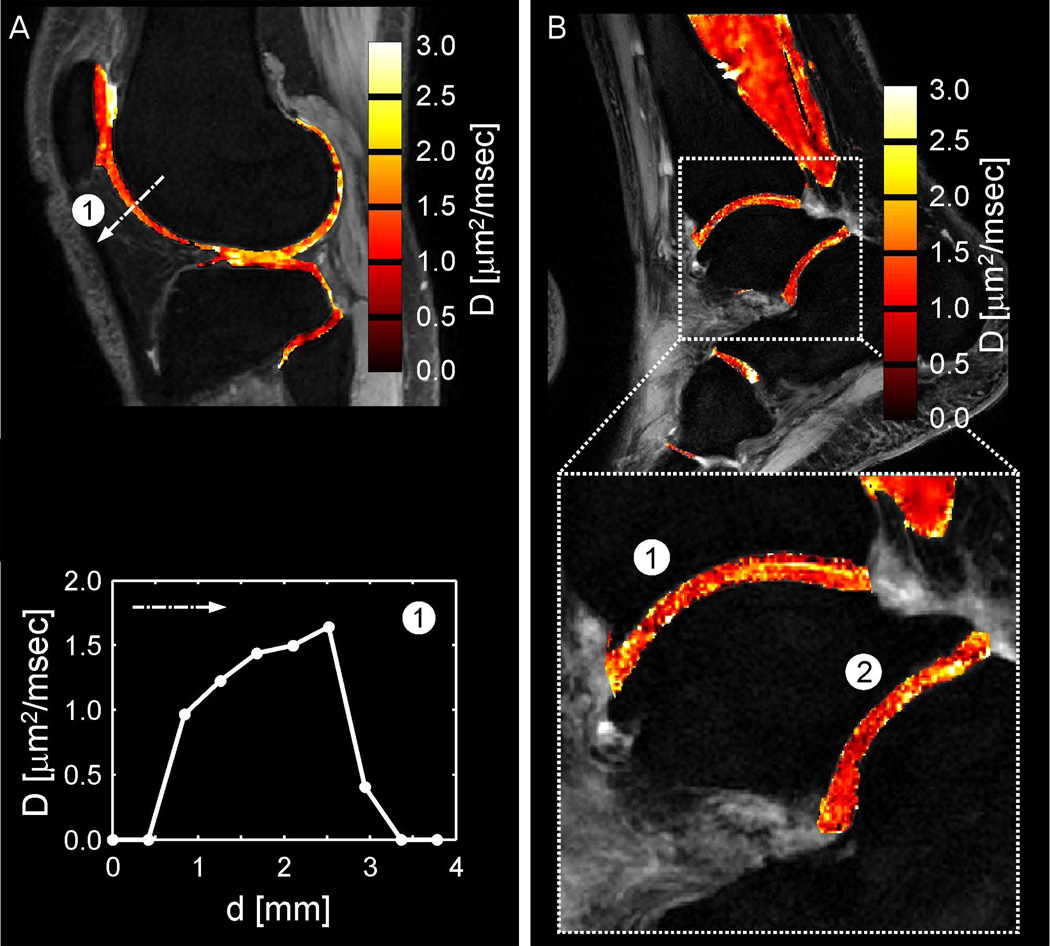
Figure 3.
A (left panel). Fusion of the derived diffusion map onto a conventional DESS image of normal appearing cartilage in the knee joint at 3.0T (derived from the nondiffusion-weighted DESS scan) and analysis of regional variations in the apparent molecular diffusion coefficient between deep and superficial femoral cartilage (along the dash-dotted line labeled with 1). B (right panel). Fusion of the derived diffusion map onto a conventional DESS image of normal appearing cartilage in the ankle joint at 3.0 T (derived from the nondiffusion-weighted DESS scan). For cartilage, D = 1.27±0.53 µm2/ms (tibiotalar joint, region 1) and D = 1.15±0.41 µm2/ms (talocalcaneal joint, region 2) is found. [Adapted from Figs. 7 and 8 of Bieri et al.(89)]

