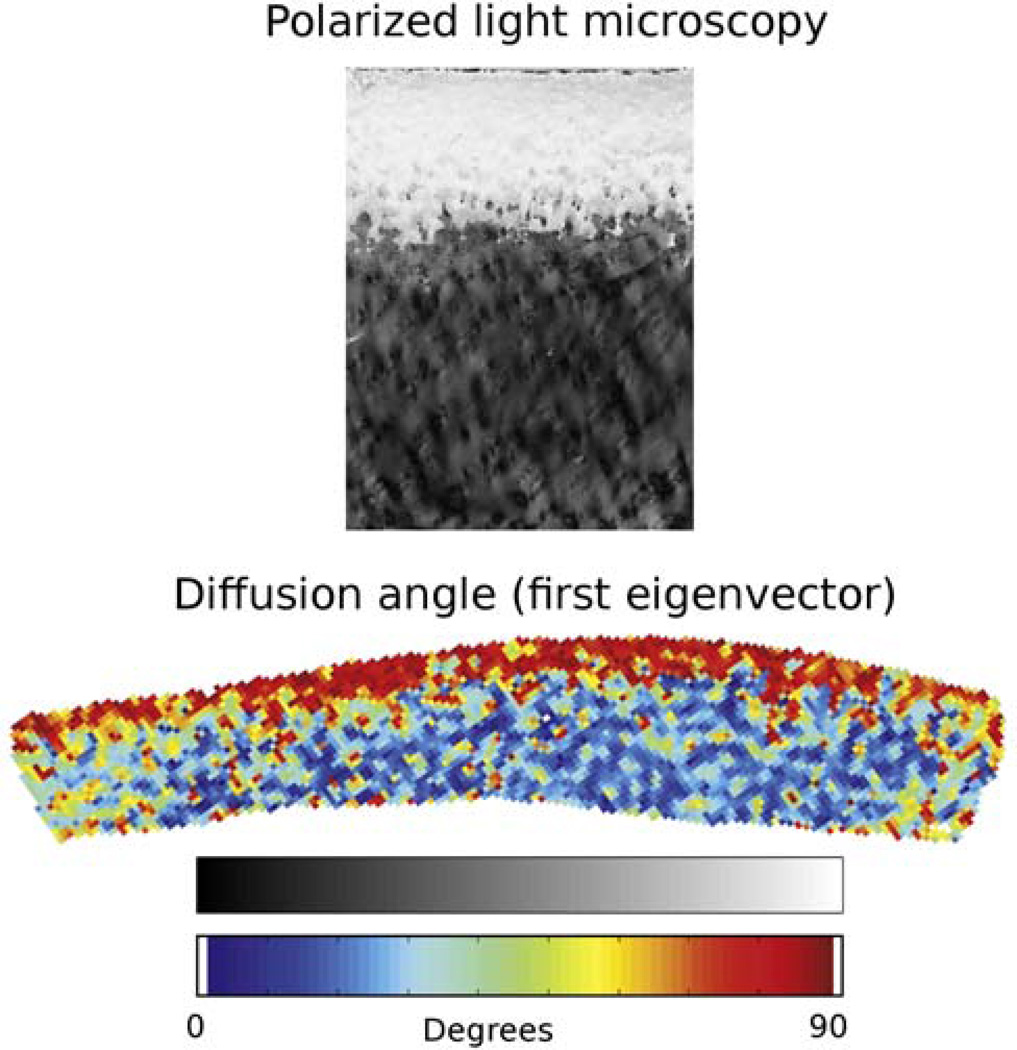
Figure 6.
Correlation of DTI measurement with the polarized light microscopy (PLM) in a sample of bovine articular cartilage (sample B of reference (112)). Top. Map of PLM polarization angle α (the angle between the “fast” optical axis and the normal to AS). White corresponds to α = 90°; black, to α = 0°. Bottom. Map of the diffusion angle θ (the angle between the principal diffusion eigenvector and the normal to AS) for the same sample. The signal intensity scale is shown down, with white corresponding to θ = 0° and black to θ = 90°. The signal from the surrounding water and bone has been removed by thresholding. [Adapted from Figs. 2 and 3 of de Visser et al. (23)]

