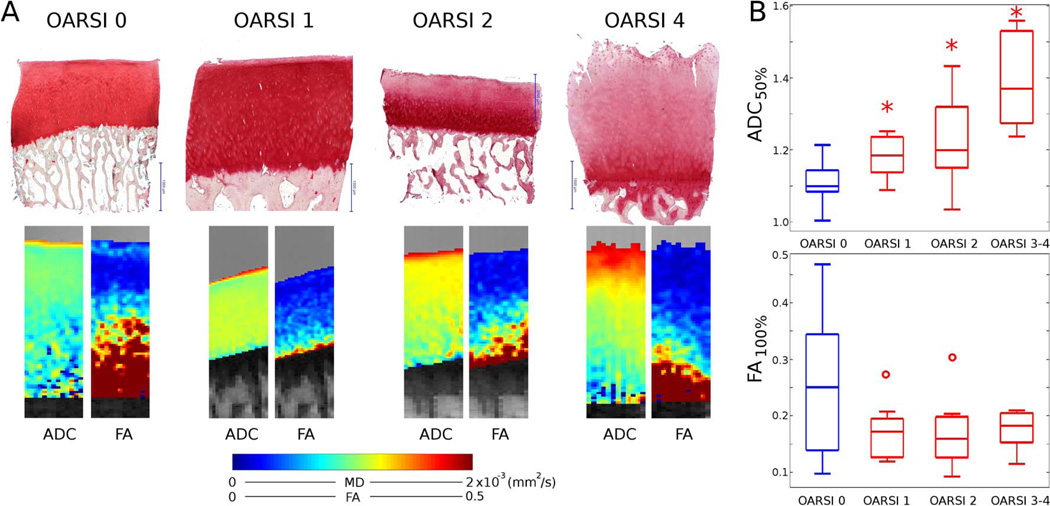
Figure 7.
Example of diffusion parameters of samples with different degrees of cartilage damage. A. Histology with safranin-O and diffusion maps (MD and FA) of samples with different grades of cartilage damage as shown by the OARSI scores. Maps show a clear trend of increased MD with increasing OARSI score and a less pronounced decrease in the FA. B. Box plot of the averaged MD over the 50% most superficial cartilage and averaged FA over the whole cartilage depth. Blue indicates average over intact cartilage (n=14 OARSI 0) and red average over cartilage with sign of degradation (OARSI 1 n = 11; OARSI 2 n = 12; OARSI ≥ 3 n = 6). Stars represent statistical significance with respect to the OARSI 0 group. Circles indicate outliers.

