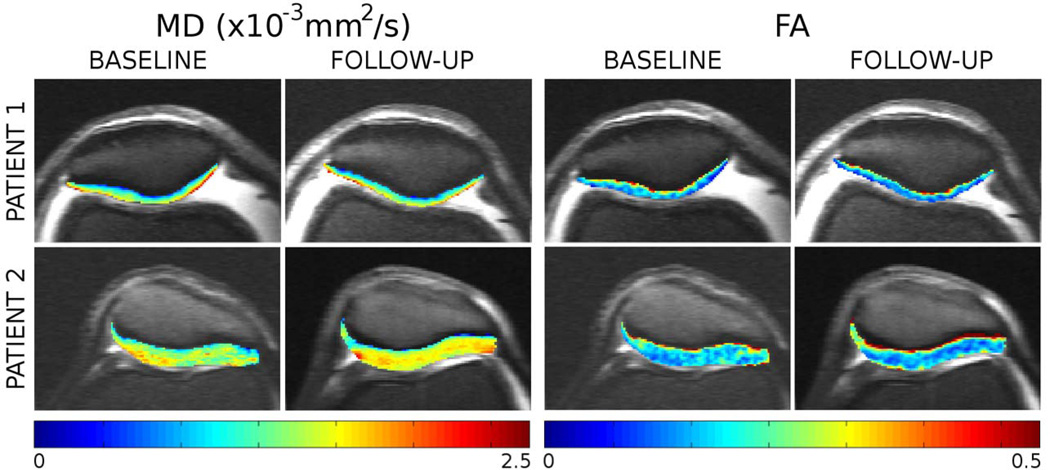
Figure 9.
Example of changes in DTI measurements on two OA patients. Patient 1 (KL 1, 61 y, 14 mo follow up) showed little change in DTI (MD +3.5%, FA-10.8%). Patient 2 (KL 2, 64 y, 20 mo follow up), who showed larger MD in the baseline also showed the largest changes in MD (+17.3%, twice the reproducibility error, +8.1%), and moderate change in FA (−17.1%, slightly under twice the reproducibility in FA, 9.7%).

