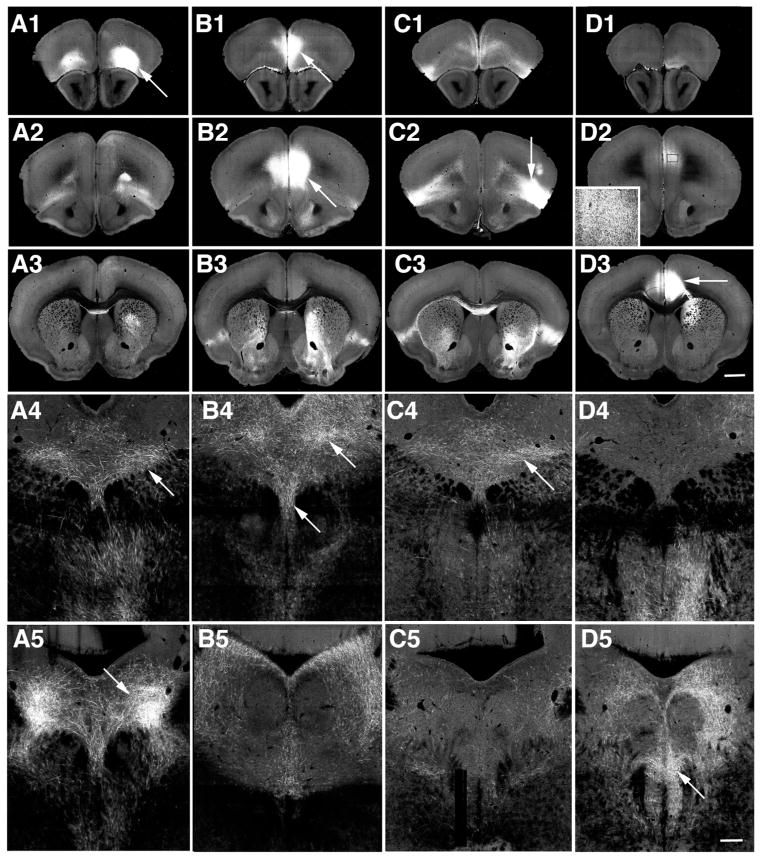
Figure 1.
Examples of selected cases from the Allen Brain Connectivity Atlas (Oh et al., 2014). Injection sites are centered on orbital (A), prelimbic (B), agranular insular (C) and anterior cingulate cortices (D). Three levels (panels 1–3) shown from approximately 20 serial sections available that span these regions as well as images of the corresponding projections to the DR and MR (panels 4,5). Each injection site (arrows, panels 1–3) captures a distinct domain. D2, boxed region shown at higher magnification in inset, shows fluorescence in the prelimbic cortex corresponds to axons and is not an extension of the injection site. Within the middle (panels 4) or caudal DR (panels 5) axons are detected in largely different patterns for each injection case. Panels 1–3 same magnification bar in D3 = 150. Panels 4–5 same magnification, bar in D5 = 150. Image credit: Allen Institute for Brain Science.

