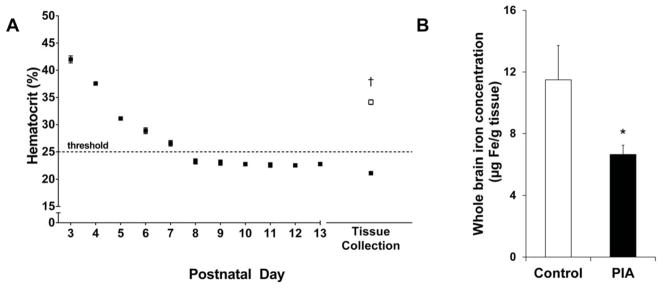
Figure 1.

(A) Daily hematocrit values Hematocrit values were determined for PIA mice (black) each day from P3 through P13. The target threshold of 25% was reached by P8 on average. At tissue collection, hematocrit values were determined for both non-bled control mice (white) and PIA mice. (B) Whole brain iron concentration at P10. The PIA group (black) is 42% iron deficient as compared to the non-bled control group (white). Values are mean ± SEM. control, n=9; PIA, n=12. * p < 0.05, † p < 0.001 vs. the control group. PIA, phlebotomy-induced anemia.
