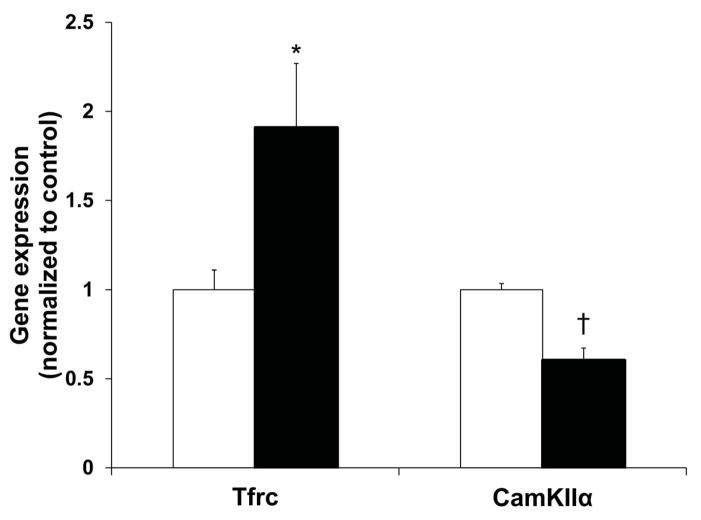
Figure 4. Gene expression changes in the hippocampus at P14.
PIA mice (black) had increased expression of Tfrc and decreased expression of CamKIIα as compared to control mice (white). Values are mean ± SEM normalized to the control group (n = 5–7 per group). * p < 0.05, † p < 0.001 vs. the control group. PIA, phlebotomy-induced anemia; Tfrc, transferrin receptor; CamKIIα, calcium/calmodulin-dependent protein kinase type II alpha.

