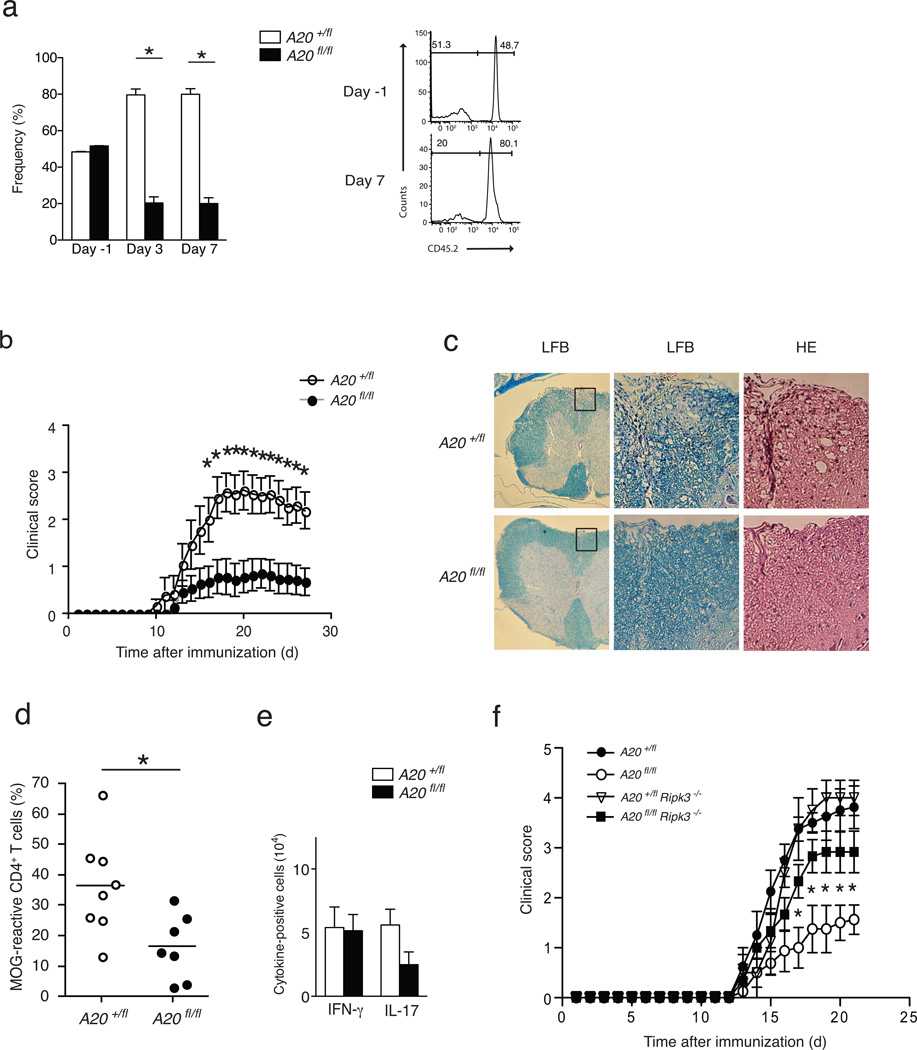
Figure 3. A20 supports antigen specific and autoimmune T cell responses in vivo.
(a) Reduced in vivo expansion of A20fl/fl CD4-Cre OT-II CD4+ T cells. FACS purified naïve (CD4+ CD62LHi CD25) CD4+ OT-II cells from congenic A20+/fl CD4-cre CD45.1/45.2 and A20FL/FL CD4-cre CD45.1 mice were mixed 1:1, and co-transferred into congenic CD45.2 C57BL/6J recipients (Day −1). Mice were immunized with LPS plus OVA peptide 24 hours later (Day 0). The percentage of live OT-II CD4+ T cells from each genotype on the indicated days is indicated. Each time point represents data from 3 mice. Representative histograms at right show CD45.2 expression after gating on CD45.1+ (donor) cells. Numbers within each histogram reflect the percentage of CD45.1+ (donor) cells that are either CD45.2 (A20fl/fl) or CD45.2+ (A20+/fl). Data analyzed by two-way ANOVA, error bars represent mean +/− SEM; n = 3 mice of each genotype from 2 independent expts. (b) Reduced EAE in A20fl/fl CD4-Cre mice. Serial EAE clinical scores of A20fl/fl CD4-Cre (fl/fl) and control A20+/fl CD4-Cre (+/fl) mice after immunization with MOG plus CFA. Means and standard errors are indicated. * indicates p < 0.05 between genotypes of mice on the indicated days. Data were obtained from 14 A20fl/fl CD4-Cre and 13 control mice and represent 2 experiments. (c) Representative histopathological analyses of spinal cord sections from the indicated mice 30 days after immunization. Luxol fast blue stains (LFB) highlighting myelin content of spinal cord sections from indicated mice (low magnification, left panels). Higher magnification images of boxed areas showing LFB and hematoxylin and eosin (HE) stains of tissue with infiltrating lymphocytes (right panels). Data are representative of 6 sets of mice and 2 experiments. (d) FACS quantitation of MOG reactive LN CD4+ T cells. Nine days after immunization with MOG, LN T cells from the indicated mice were harvested, labeled with CFSE, and re-stimulated with MOG for 3 days in vitro. The percentage of CFSE labeled T cells in diluted versus non-diluted peaks after 3 days is indicated. Horizontal lines indicate means. * indicates p < 0.05 by Students T test; n = 7 and 8 mice from 2 experiments. (e) Reduced TH17 cells from A20fl/fl CD4-Cre mice during EAE. Lymph node CD4+ T cells from MOG immunized mice of the indicated genotypes were harvested, restimulated in vitro, and quantitated by flow cytometry for intracellular expression of the indicated cytokines. The numbers of CD4+ T cells expressing IFNγ and IL17 are displayed. Data analyzed by Student’s T test; horizontal lines indicate means +/− SEMs; n = 3 sets of mice in 2 experiments. (f) RIPK3 deficiency restores EAE susceptibility of A20fl/fl CD4-Cre mice. Serial EAE clinical scores of RAG-1−/− mice bearing T cells of the indicated genotypes after immunization with MOG. Means and standard errors are indicated. Note that A20fl/fl CD4-Cre RIPK3−/− T cells (filled squares) cause significantly more severe EAE symptoms than A20fl/fl CD4-Cre T cells (open circles). Data analyzed by two way ANOVA; p < 0.05 between A20FL/FL CD4-Cre and A20fl/fl CD4-Cre RIPK3−/− T cells for all days after day 17; n = 5 mice of each genotype in 2 experiments.

