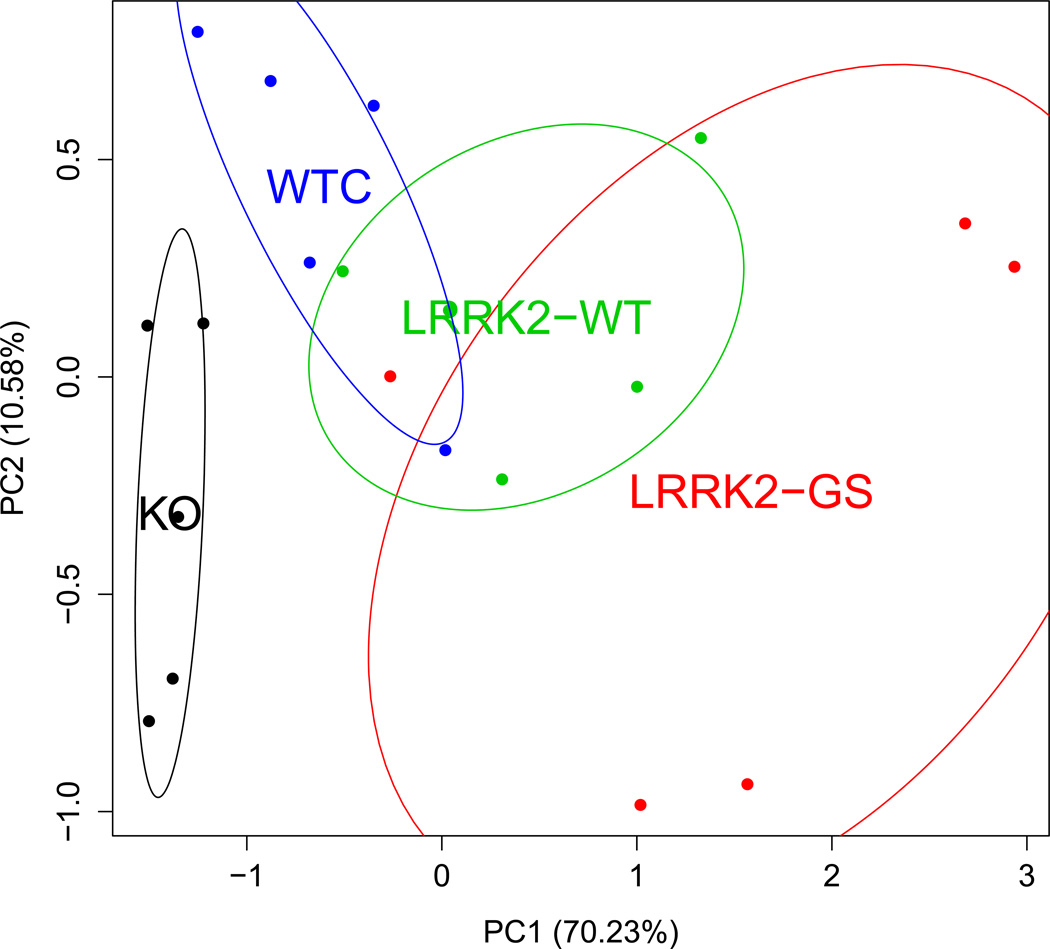
Fig. 1. Principal component analyses in mice.
Blood expression profiles discriminate between mice with altered LRRK2 genes. Twelve markers were evaluated for significant differences among the following four mouse groups using an F-test: WTC, KO, transgenic LRRK2-WT and LRRK2-GS. Markers with a q-value of 0.1 were used to construct the principal component analysis (PCA) plot. The percentage of explained variance is indicated in parenthesis on each axis. The four groups show consistent separation, with KO mice and the over-expressing transgenic lines appearing on opposite sides of WT. While the GS group is more variable than the other three, it appears to yield the most extreme expression alterations. Ellipses show the mean and 1 standard deviation for the multivariate distribution.

