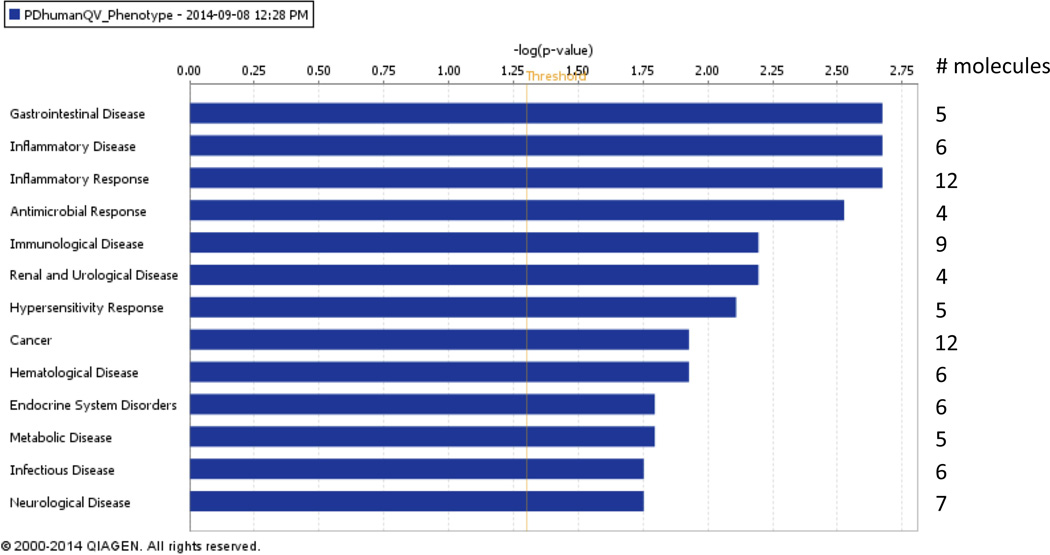
Fig. 4. Functional network analysis of the PD human gene signature.
Bar-plot of the diseases and disorders that are over-represented in the 14 PD-phenotype-associated markers in our human dataset. Cutoff for the expression values (i.e. q-values) was set to 0.1 in order to select the 14 signature markers. The IPA Functional Analysis shows that several genes among the 14 discriminating PD disease markers are significantly linked to inflammatory disease, inflammatory response, immunological disease, as well as neurological disease. Uncorrected p-values (Fisher's Exact Test p-value) were measured.

