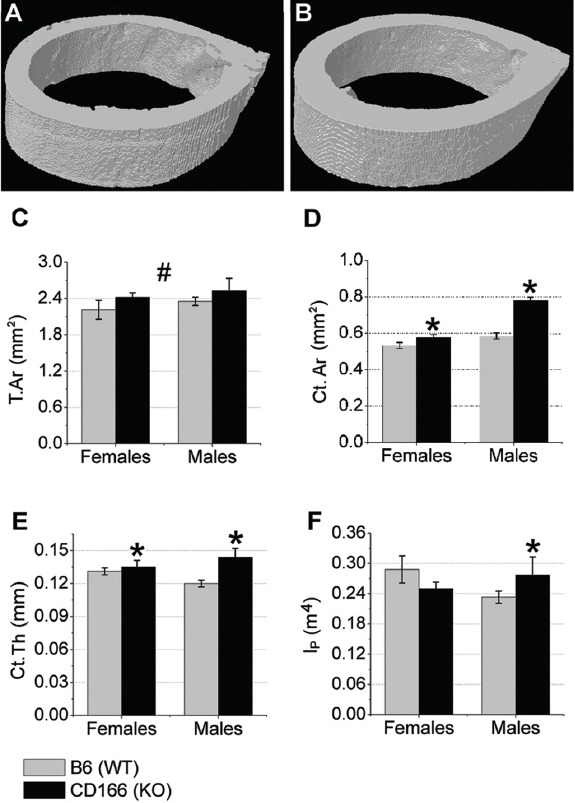
Figure 4.

μCT was used to examine the cortical bone phenotype from the mid-shaft femur of 6 week-old, (A) WT and (B) CD166-/- mice. Cortical (C) T.Ar, (D) Ct.Ar, (E) Ct.Th, and (F) IP. n=7-10 mice/group. Results are presented as the mean ± SE. *Indicates significant interaction between genotype and sex, with post-hoc analyses indicating sex-specific genotype differences (p<0.05). #Indicates significant main effect for genotype, with no significant interaction found between genotype and sex (p<0.05).
