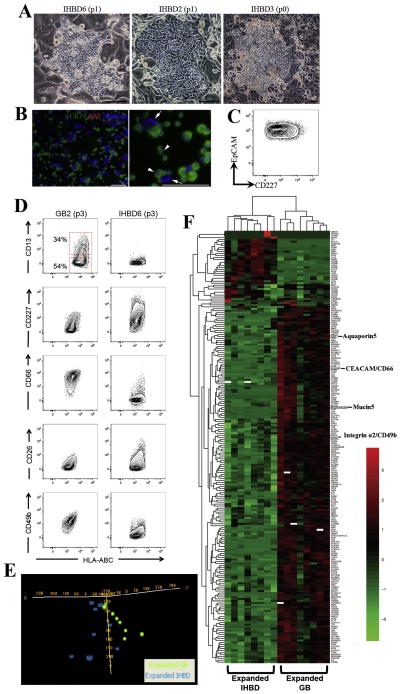
Figure 5. Expanded gallbladder and IHBD cells have unique phenotypic and expression profiles.
(A) Livers were digested and total cells were plated on rat feeder cells. Usually following two passages, we observed a robust expansion of bile duct colonies. Occasionally bile duct colonies were observed at the first expansion (p0). Representative pictures of 3 fetal liver samples at early passage indicating IHBD cell expansion. (B) Immunofluorescence analysis of an IHBD culture showing that all cells were CK19+AAT− (arrowheads). Arrows indicate rat feeder cells. (C) Flow cytometric profile of IHBD6 (passage 1) showing that all cells are EpCAM+CD227+. The plot display 5% probability contours of live IHBD cells. Scale bars: 100μm. (D) Expanded IHBD cells (n=5) were screened with the same panel of cell surface markers screened on gallbladder cells (n=5). We found expression of CD13, CD227, CD66, CD26, and CD49b were different between expanded gallbladder and IHBD cells. All plots display 5% probability contours and the number values assigned to the gates (red boxes) represent the percentage of live gallbladder cells within that gate. (E) Oligonucleotide microarrays were performed on expanded IHBD cells (n=8) and gallbladder (GB) cells (n=8) cells. PCA was performed by Euclidean correlation. The data indicate that IHBD cells (6 out of 8 samples) and gallbladder cells (6 out of 8 samples) self-segregate into two independent groups. (F) Heatmap of 193 genes differentially regulated (p<0.001, q<0.05, fold change ≥2) between IHBD and gallbladder cells defined in BRB Analysis Toolpack. This list comprises 171 genes upregulated and 22 genes downregulated in gallbladder cells relative to IHBD cells. Heatmaps were generated in R (package- pheatmap) by using Euclidean distance measure and complete linkage. Black represents genes whose expression was at the mean intensity; red represents intensities that are greater than the mean; green represents intensities that are less than the mean. White boxes indicate genes whose expression was adjusted to 0, when differentially regulated transcripts were initially defined in BRB Analysis Toolpack. Scale bars: 100μm.

