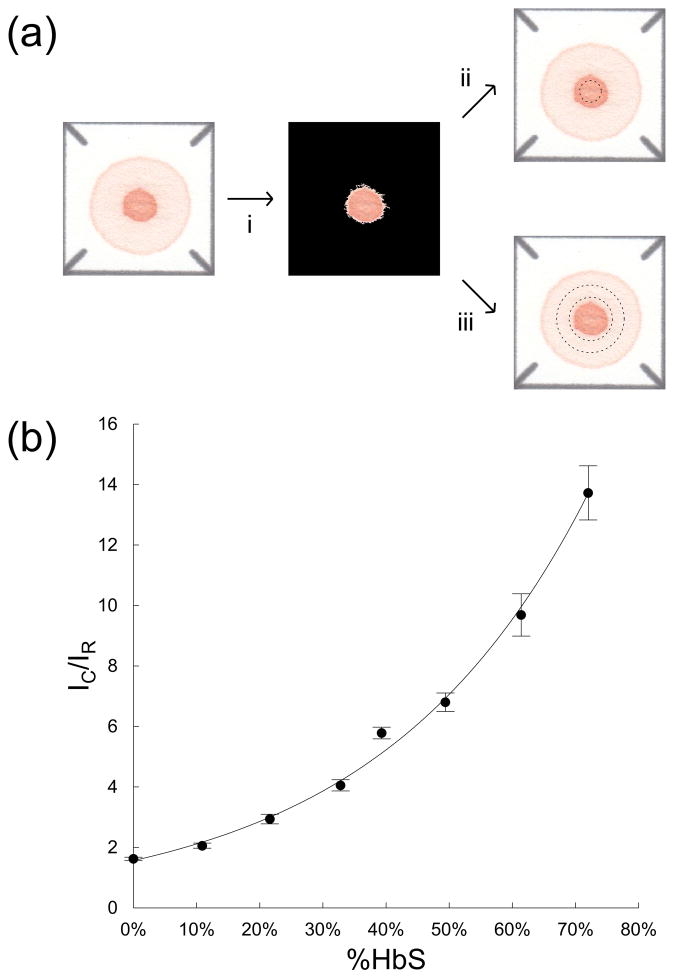
Figure 2.
Using a blood stain to estimate %HbS. (a) Schematic illustration of image analysis algorithm. (a-i) Centroid of the blood stain (marked by a cross) is automatically identified by the algorithm using contrast stretching and thresholding. (a-ii) The center spot (area inside dashed circle) and (a-iii) the peripheral ring (area between dashed circles) are extracted from the image through application of binary masks centered on the centroid of the stain. Mean color intensities of the center spot (IC) and the peripheral ring (IR) are extracted from the standardized blood stain. (b) Dependence of IC/IR on %HbS for a series of reconstituted blood (n = 5) samples with artificially adjusted %HbS varying from 0 to 75% (calibration curve, solid line). The values of the quotient of mean color intensities increased exponentially with increasing %HbS.

