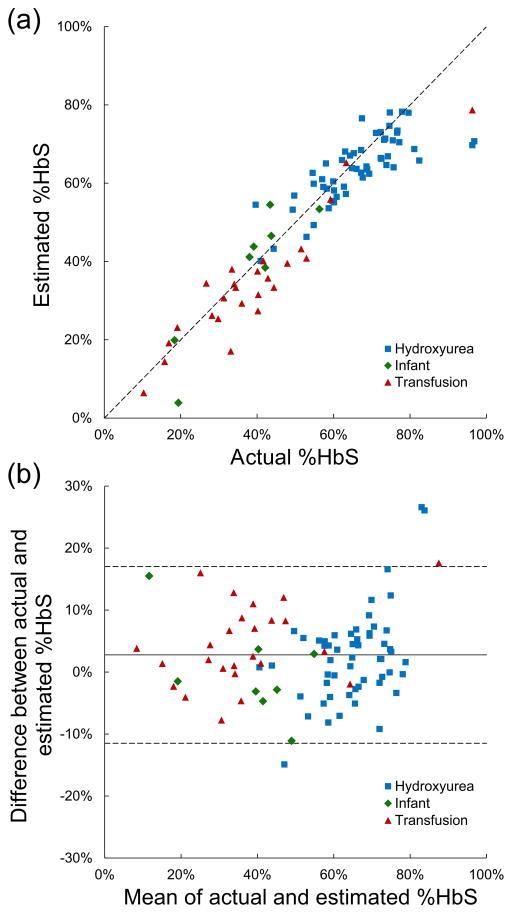
Figure 3.
Comparison of paper-based %HbS measurements with a reference method (hemoglobin electrophoresis). (a) %HbS for a group of patient samples (n = 88) was measured using the paper-based assay (Estimated %HbS) and conventional Hb electrophoresis (Actual %HbS). Estimated %HbS is highly correlated (R2 = 0.86) with actual %HbS (solid line = data trend line; dashed line = perfect correlation). Patient characteristics are indicated by dot color. (b) Bland–Altman plot shows strong agreement (SD difference = 7 %HbS) between estimated and actual %HbS (solid line = mean difference; dashed lines = ± 2 SD difference). The majority of the differences between actual and estimated %HbS (95.5%) are within 2 standard deviations of the mean of the differences. Patient characteristics are indicated by dot color.

