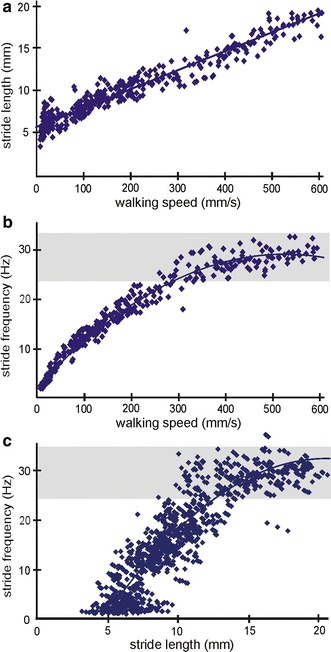
Fig. 2.

General walking parameters, stride length, stride frequency and walking speed and their relationships. Only middle leg data are plotted; each data point represents one video sequence (N = 388). a Stride length as a function of walking speed for the entire walking speed range. Linear regression is indicated; y = 0.023 × x + 5.93; R 2 = 0.93. b Stride frequency as a function of walking speed. Best fit regression is indicated; y = −0.0001 x 2 + 0.11x + 1.63; R 2 = 0.97. c Stride frequency as a function of stride length. Best fit regression is indicated; y = −0.115x 2 + 4.78x − 19.77; R 2 = 0.81. The grey horizontal bar highlights the frequency plateau (b, c)
