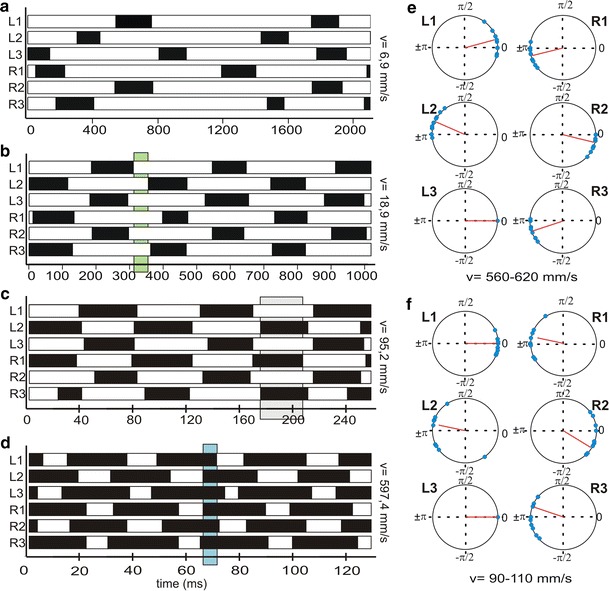
Fig. 4.

Analysis of inter-leg coordination. (a–d) Footfall patterns, podograms, of all six legs from four runs with different walking speeds, from minimum to almost maximum speed. White bars represent stance phases, black bars represent swing phases; L left, R right body side; 1, 2 and 3, front-, mid- and hind leg. Shaded areas highlight exemplary tripod gait patterns with stance phase overlap (green, see b) and swing phase overlap (blue, compare d). Shaded area (grey, compare c) highlights an exemplary footfall pattern with a TCS of 0.77. Walking speeds are 6.9 mms−1 (a), 18.9 mms−1 (b), 95.2 mms−1 (c) and 597.4 mms−1 (d). (e, f) Phase plots of the stance, phase onset of all legs with respect to the left hind leg; L1, L2, L3, left side front, middle and hind leg; R1, R2, R3 right side front, middle and hind leg. Two exemplary walking speed ranges are shown, 560–620 mms−1 (e) and 90–110 mms−1 (f). Blue data from five runs; red line mean vector
