Fig. 5.

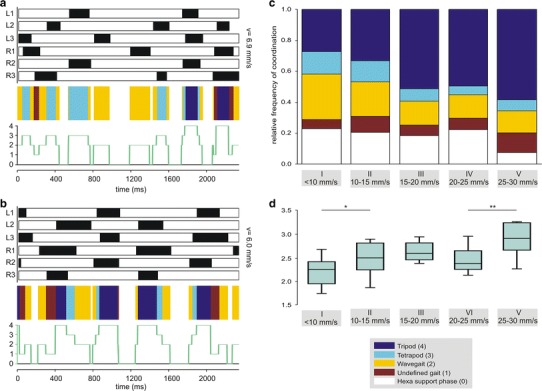
Quantification of gait pattern during slow walking. Gait Pattern analysis for ants walking at a 6898 mms−1 and b 5959 mms−1. (a, b) Podogram (above), coloured coding (middle) and indexing (below). Illustration details of the podograms as in Fig. 4. For the colour coding and the indexing we used five different classifications: ‘tripod’ (dark-blue, 4), ‘tetrapod’ (light-blue, 3), ‘wavegait’ (yellow, 2) or ‘hexa support phase’ (white, 0). If none of these possibilities were applicable, the frame was classified as ‘undefined’ (red, 1). For the list of exact leg combinations representing a typical gait see supplementary material. c Quantification of the N = 76 slow walking speed videos were grouped into five categories: I 5–10 mms−1 (17 videos, 8950 frames; 27, 14, 29, 6, 23 %), II 10–15 mms−1 (16 videos, 7376 frames; 33, 14, 22, 10, 21 %), III 15–20 mms−1 (20 videos, 7116 frames, 51, 8, 15, 6, 18 %), IV 20–25 mms−1 (14 videos, 4284 frames; V 25–30 mms−1 (9 videos, 2423 frames; 58, 7, 15, 13, 7 %). The percentage information in brackets after the semicolon is rounded and is arranged as follows: tripod, tetrapod, wavegait, undefined gait, hexa support phase. d The averaged index for each video provide a more individual analysis of the ants’ walk. Group I differs significantly from group II (t test; p = 0,014); the same was true for group IV and group V (t test; p = 0,004). The three intermediate speed groups (II, III, IV) do not show any statistically significant differences to their respective neighbouring groups
