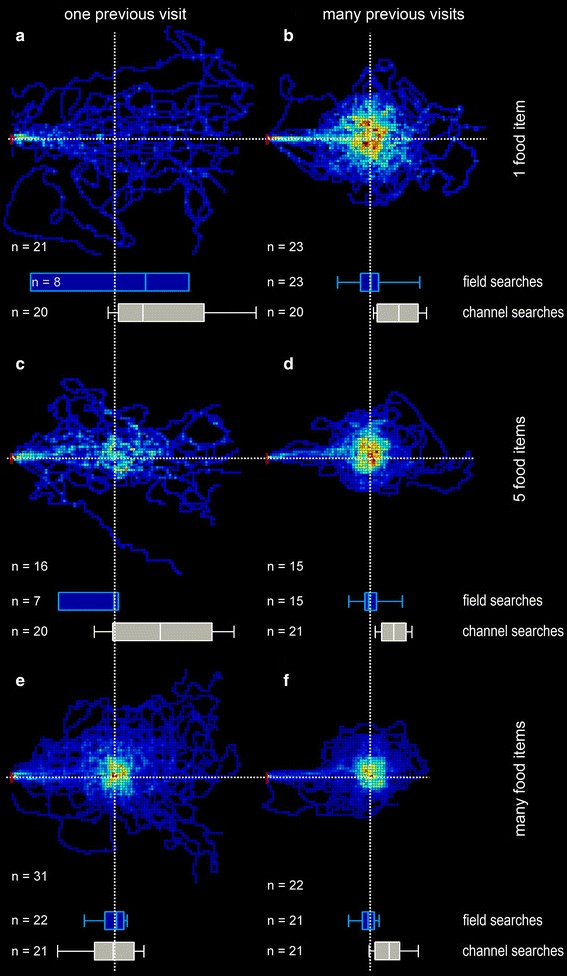
Fig. 2.

Desert ant food search behaviour is dependent on (1) the amount of food present in the feeder, (2) the experience during repeated visits, that is, learning about feeder reliability and (3) the experimental situation, that is, channel or field experiments. Field searches In experiments on the open desert terrain, the number of ants’ visits to each 25 × 25 cm pixel of the density plot was recorded, summed and normalised to the maximum number of visits per pixel observed in the plot. The darkest red represents the highest density (100 %), the darkest blue just a single visit (note individual walking trajectories discernible close to the plot margins), and black areas were not searched at all (0 %). Nest-feeder distance was 10 m; nest position is noted by red indicator line on the left of each graph. Feeder position before testing is marked by white dotted cross lines; food supply of the feeder and number of previous (training) visits are noted in the margins of columns and rows, respectively; numbers of ants tested are noted in the lower left of each plot. Field searches along nest-feeder axis Search performances along the nest-feeder axis are shown as blue box-and-whisker plots just below the density plots they are derived from (see “Methods”; any movements perpendicular to the nest-feeder axis were disregarded, and six turning points on the nest-feeder axis were evaluated). Channel searches Corresponding grey box-and-whisker plots from channel experiments are shown below the plots derived from the field experiments. Data of the channel experiments are taken from a previous study (Bolek et al. 2012b); see “Methods”. Box-and-whisker plots show medians, 25 and 75 % percentiles (box margins) and 10 and 90 % percentiles (whiskers) in this and all following figures
