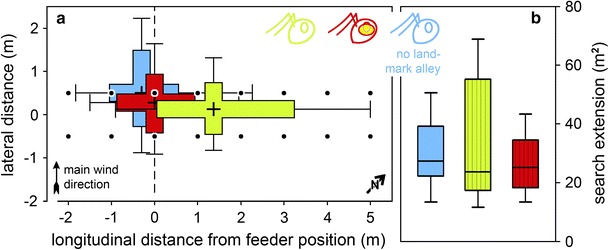
Fig. 5.

Search distribution characteristics (a), and search areas (b) of field searches. Details of the box plots are as in the previous figures, including colour identification of experimental groups. a For each individual ant, the search centres were calculated along the nest-feeder axis (abscissa, longitudinal distance) and along the axis perpendicular to it (ordinate, lateral distance) from all the x and y values in the search trajectory, including the box-and-whisker percentiles. Medians of all animals in an experimental group are shown to characterise the search distributions (e.g. the whisker at 5 m longitudinal distance represents the median of all 90 % percentiles in the field visual group). Note in the field visual group (green), the shift of search centre to 1.36 m (0.13 m lateral distance) along the landmark alley and the much increased longitudinal spread of the search distribution (3.21 m between 25 and 75 % percentiles, compared to 1.59 and 1.17 m in the field “blind” and the field control groups, respectively). Search width was reduced, by comparison (1.20 m between 25 and 75 % percentiles, compared to 1.36 and 1.78 m in the field “blind” and the field control groups). The landmark alley is drawn to scale on top of the search characteristics’ “crosshairs”. b Search areas were not altered by the presence of leading structures. Vertically hatched boxes indicate experiments with the landmark array present
