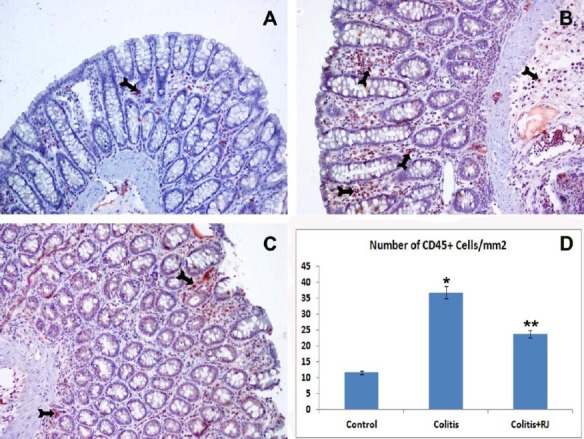
Figure 7.

CD45-positive T lymphocytes. Control (A); TNBS-induced colitis (B); colitis+RJ (C) (immunoperoxidase, haematoxylin counterstain, 200×); Distribution and number of CD45 positive T cells (Arrows) (D). * P<0.05 compared with the control group; ** P<0.05; compared with the control and colitis groups
