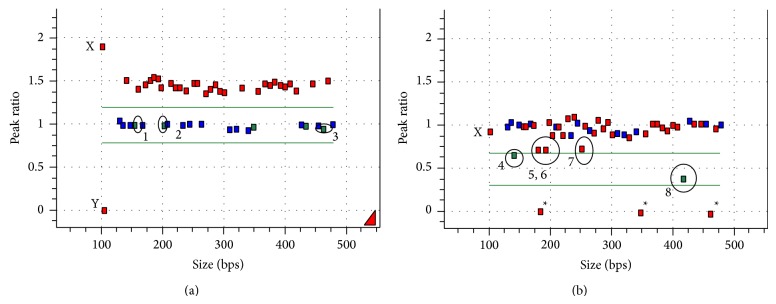
Figure 2.

MS-MLPA analysis for determination of 15q11.2 duplication. x-axes represent fragment size in bps and y-axes represent probe peak ratios. (a) MLPA copy number peak ratio: red = PWS/AS region probes; green = non-PWS/AS region probes. 1 = TUBGCP5; 2 = APBA2; 3 = NIPA1; X (2 copies) and Y (0 copies) chromosome in female patient. (b) MS-MLPA digestion of five HhaI methylation sensitive probes: 4 = SNRPN intron 1; 5 = SNRPN exon 1; 6 = SNRPN intron 1; 7 = SNRPN promoter; 8 = NDN; ∗ = HhaI digestion controls.
