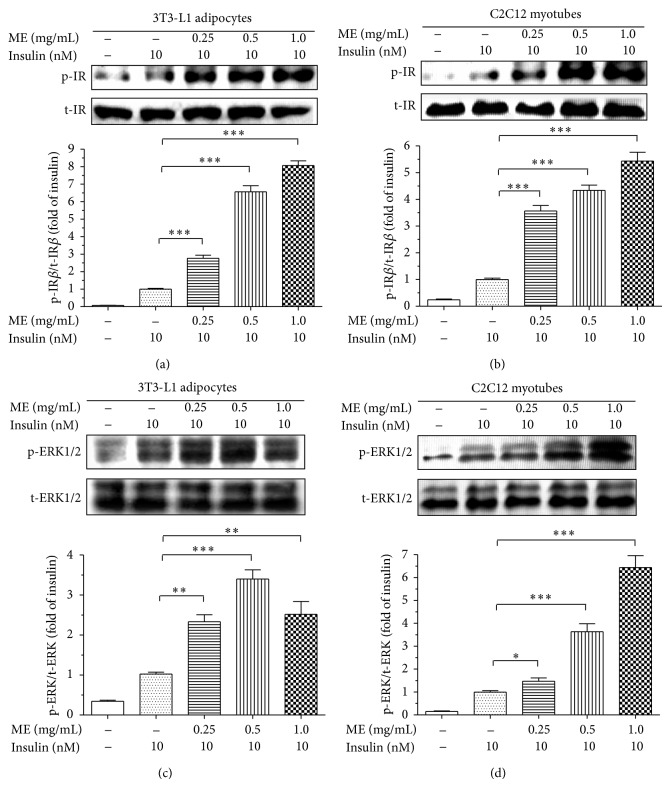
Figure 4.
Effects of ME on insulin signaling pathway. Differentiated 3T3-L1 adipocytes (a and c) and C2C12 myotubes (b and d) were starved for 4 h before stimulation. The cells were incubated with vehicle or ME at various concentrations for 30 min and then stimulated with vehicle or 10 nM insulin for 5 min. Tyrosine phosphorylations of IR and ERK were determined by Western blotting with anti-phospho-IRβ and anti-phospho-ERK1/2 antibodies and were normalized with IR and ERK protein, respectively, which were then calculated as fold changes of insulin alone. Data are presented as mean ± SEM (n = 3). ∗ P < 0.05, ∗∗ P < 0.01, ∗∗∗ P < 0.001 versus insulin alone.

