Figure 1.
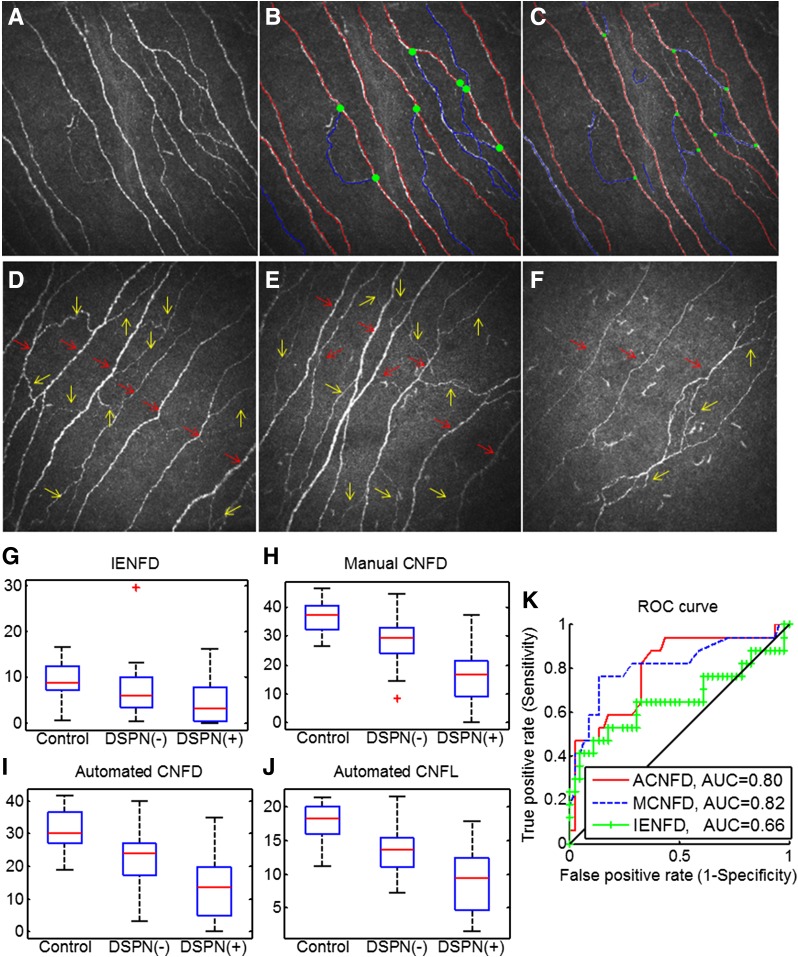
A: Original CCM image. B: Manually quantified CCM image. C: Automatically quantified CCM image. The red lines represent main nerve fibers, blue lines are branches, and green spots indicate branch points on the main nerve trunks. CCM images of the subbasal nerve plexus from a control subject (D), a DSPN(−) patient with type 1 diabetes (E), and a DSPN(+) patient with type 1 diabetes (F) show the reduction in corneal nerves in the DSPN(+) patient. The red arrows indicate main nerve fibers (to calculate CNFD), and yellow arrows indicate branch fibers (to calculate CNBD). Box plots of IENFD (G), manual CNFD values (H), automated CNFD (I), and automated CNFL (J) values in controls and in DSPN(−) and DSPN(+) patients with type 1 diabetes based on the TC. K: ROC curves for manual CNFD (MCNFD), automated CNFD (ACNFD), and IENFD to discriminate DSPN(+) and DSPN(−) patients with diabetes. G–J: Red lines represent median, the box borders 25th and 75th percentile. Whiskers represent the range of the data (without outliers). Red plus symbols represent outliers.

