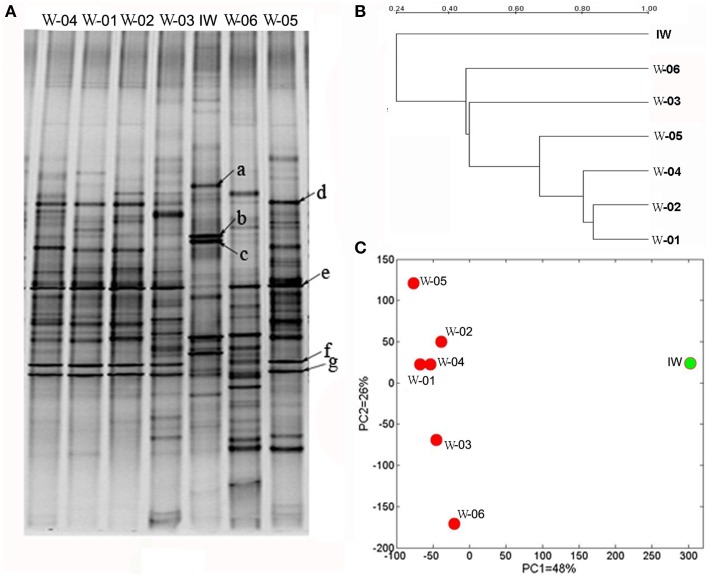
Figure 2.
DGGE profiles of PCR-amplified 16S rRNA gene fragments of bacterial communities from one injection water sample and six production water samples. (A) DGGE profiles of the bacterial communities, (B) clustering analysis of the DGGE digitalized data, and (C) scatter plot of the results from the principal component analysis (PCA) of the DGGE digitalized data. IW, injection water sample; W-01 to W-06, production water samples.

