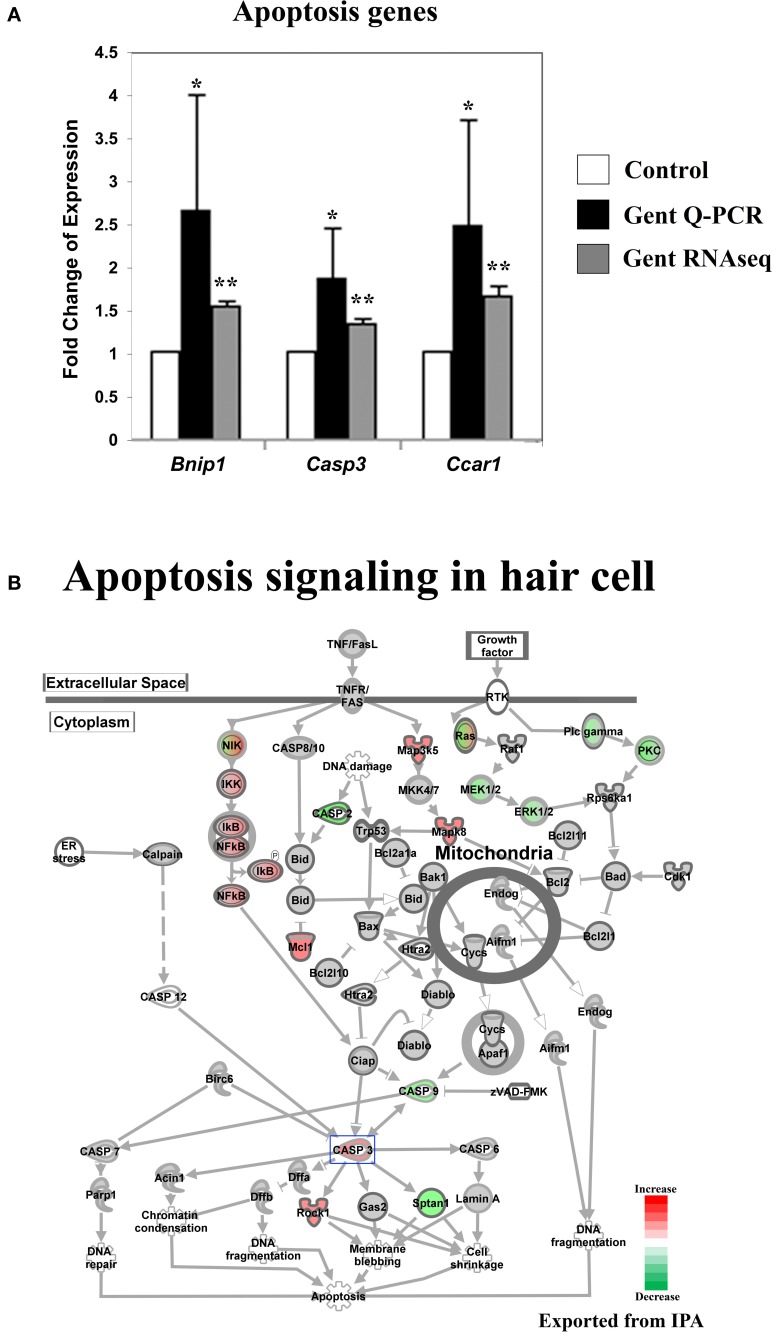
Figure 5.
Gentamicin-induced changes in expression of genes involved in apoptosis. (A) Q-PCR results validating increased messenger RNA levels in hair cells after gentamicin treatment. Error bar, standard deviation: *p < 0.05; **p < 0.01. (B) The apoptosis gene network with color-coded expression changes showing the absence of significant changes for apoptosis initiation and execution genes at transcriptional level. Only genes with significant expression changes are colored. Red, increased expression; green, decreased expression relative to control; half red-half green, indicates nodes with multiple genes with some genes upregulated and some genes downregulated. Genes validated and discussed in the text are boxed in the corresponding protein pathway diagrams.

