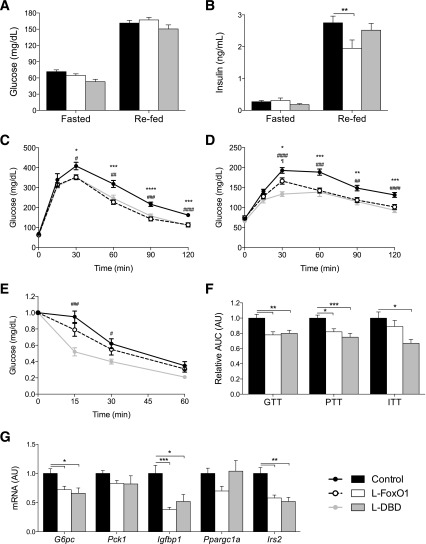
Figure 3.
Glucose metabolism in L-FoxO1 and L-DBD Mice. Glucose (A) and insulin (B) levels in mice fasted overnight or refed for 4 h. **P < 0.01 by Tukey post hoc analysis after two-way ANOVA. Glucose (C) and pyruvate (D) tolerance tests in overnight-fasted mice. E: Insulin tolerance test in 5-h–fasted mice. For C–E, *P < 0.05, **P < 0.01, ***P < 0.001 for control vs. L-FoxO1; #P < 0.05, ##P < 0.01, ###P < 0.001, ####P < 0.0001 for control vs. L-DBD. F: Quantification of the AUC for the results in C–E. G: Gene expression levels in fasted livers assessed by RT-PCR. For F and G, *P < 0.05, **P < 0.01, ***P < 0.001 by Tukey post hoc analysis after one-way ANOVA. All mice were reared on a chow diet, and studies were performed at 16–20 weeks of age. N ≥ 9 for all genotypes in all experiments. Data represent the mean ± SEM. AU, arbitrary units; GTT glucose tolerance test; ITT insulin tolerance test.

