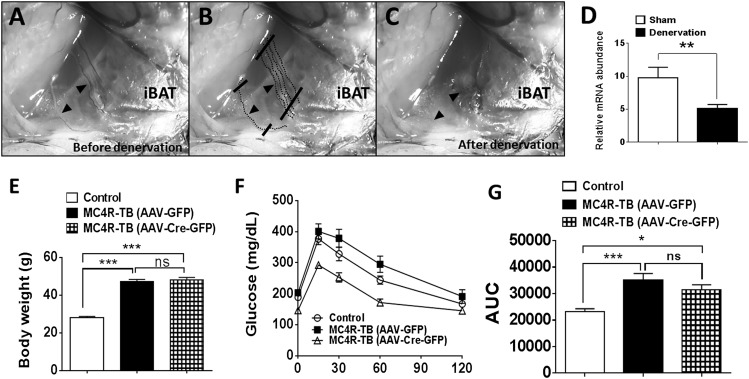
Figure 8.
Bilateral iBAT denervation prevents the glucoregulatory effect of MC4RLHA signaling. A: Representative image showing five branches of intercostal nerves (arrows) before denervation. B: Five branches of intercostal nerves were sectioned out as shown. C: Representative image showing postsurgical iBAT denervation. D: iBAT denervation in WT male mice significantly decreased UCP1 mRNA expression in iBAT compared with sham control WT mice. E: Body weight of each group of mice after 1 week of iBAT denervation. F and G: GTT and its AUC analysis after iBAT denervation. Data are mean ± SEM. *P < 0.05, **P < 0.01, ***P < 0.001 by Student t test or one-way ANOVA with Bonferroni post hoc analysis. AUC, area under the curve.

