
Figure 1.
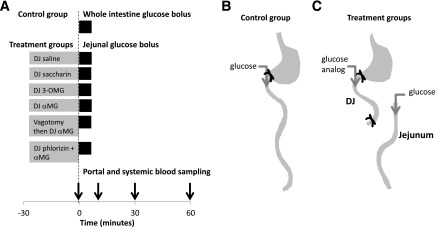
Experimental design. A: Time line of intestinal infusion and blood sampling. Gray bars indicate the substances infused into the DJ segment prior to the sampling period. Black bars indicate the 5-min glucose bolus into whole intestine (control) or jejunum (treatment). B: Whole intestine glucose bolus controls, in which glucose was infused into the duodenum. C: Treatment groups, in which agonists were infused into the DJ segment followed by a glucose bolus into the jejunum. See Research Design and Methods for details.