
Figure 3.
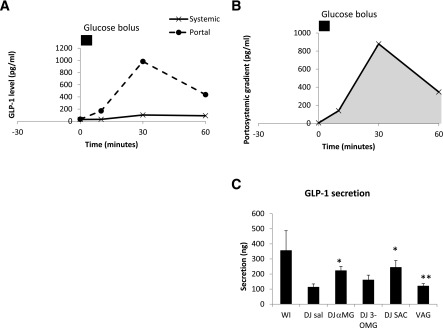
Portal and systemic GLP-1 excursions after intestinal glucose bolus in experimental groups. A: Control group. WI infusion. B: Portosystemic GLP-1 gradient, which was calculated as the difference between the portal and systemic GLP-1 levels. The gray AUC was used to calculate GLP-1 secretion. C: Effect of DJ stimulation on intestinal GLP-1 secretion and effect of vagotomy (VAG). *P < 0.05 vs. DJ SAL; **P < 0.05 vs. DJ αMG.