. 2014 Jul 9;10(32):6077–6086. doi: 10.1039/c4sm00884g

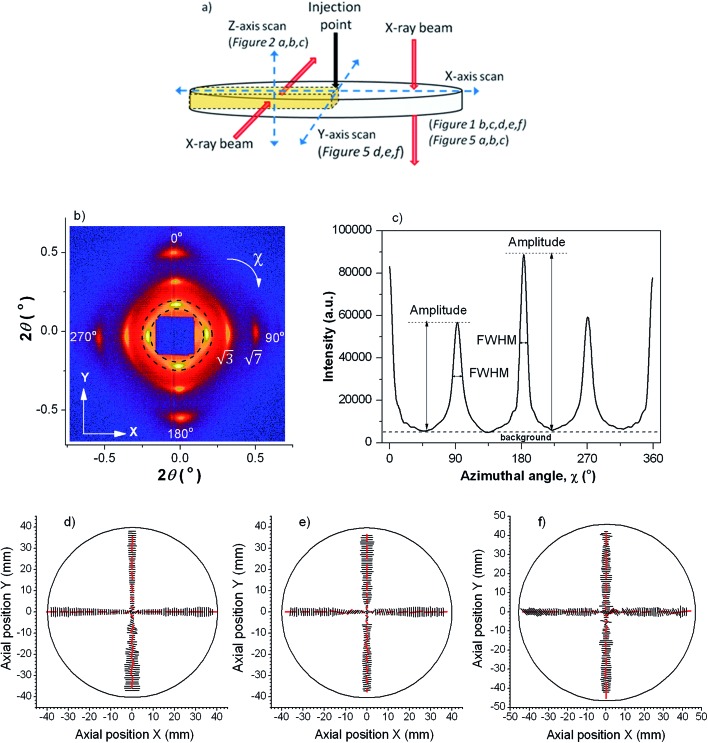
Fig. 1. (a) Sample geometry with paths of SAXS scans and corresponding X-ray beam directions indicated. (b) Representative experimental SAXS pattern as scanned along the X axis; the area of azimuthal integration is indicated. Sample thickness was 0.95 mm and injection rate 7 × 10⁻⁸ m3 s–1. (c) Integrated azimuthal intensity profile. Peaks at 0° and 180° are from radially oriented cylinders; those at 90° and 270° are from circumferentially oriented cylinders. (d, e and f) Vector plot representations of molecular orientation along X and Y axes for various sample thicknesses: (d) 0.95 mm, (e) 0.45 mm, (f) 0.23 mm. Direction of the vectors indicates the orientation direction and the length of the vector is proportional to the degree of orientation.

Fig. 1