
Figure 4.
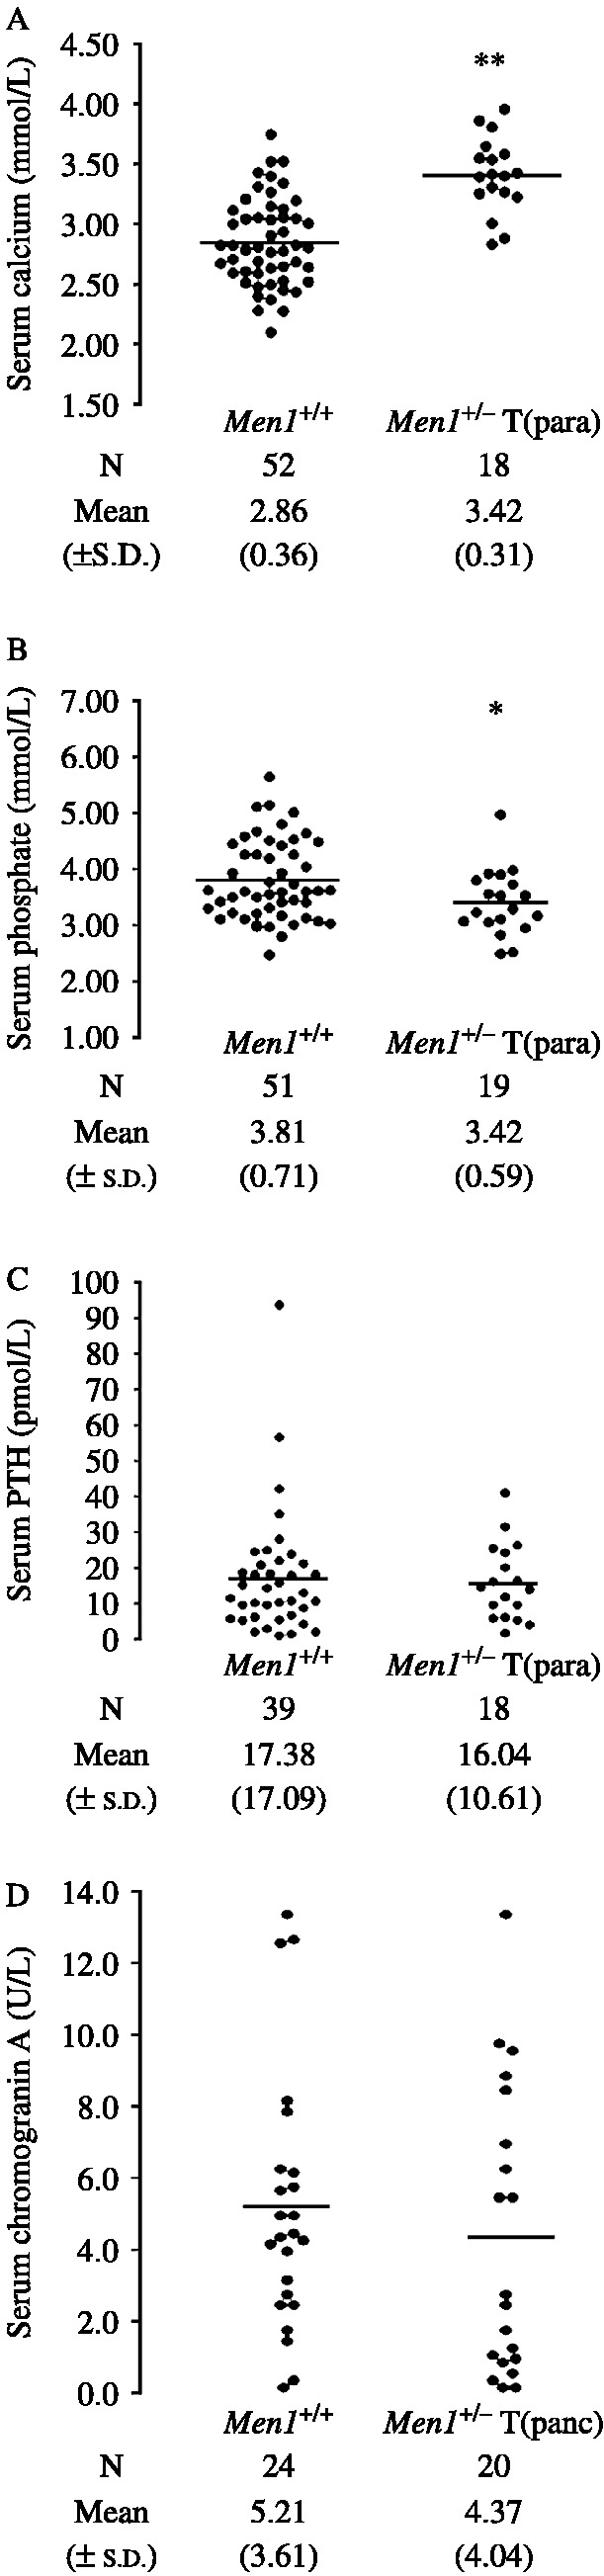
Serum calcium, phosphate, PTH and chromogranin A concentrations. (A) Serum calcium adjusted for albumin, (B) serum phosphate, and (C) serum PTH concentrations in Men1+/+ and Men1+/− mice with parathyroid hyperplasia or adenomas (Men1+/−T(para)). (D) Serum chromogranin A concentrations in Men1+/+ and Men1+/− mice with histologically proven pancreatic tumours (Men1+/−T(panc)). The results for individual mice are shown. The bars show the mean for each group. P values, *<0.05, **<0.001. The Men1+/−T(para) mice were significantly hypercalcaemic and hypophosphataemic when compared to the Men1+/+ mice. The serum PTH concentrations were similar in both groups, but the occurrence of a serum PTH concentration in the normal range in association with hypercalcaemia is considered to be inappropriate, and consistent with primary hyperparathyroidism (Eastell et al. 2009).