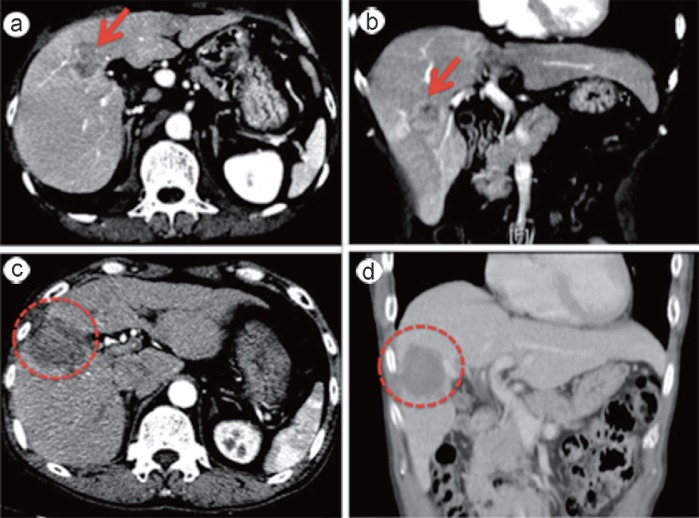
Fig. 3.
Representative CT images of pre-RFA (a,b) and post-RFA (c,d). a An axial image of the tumor (arrow) in the hepatic arterial phase. b A coronal image of the tumor (arrow) in the hepatic arterial phase. c A post-RFA axial image. The tumor was evaluated as ablative margin (AM) sufficient (surrounded by the dotted line). d A post-RFA coronal image. The tumor was evaluated as AM sufficient (surrounded by the dotted line).

