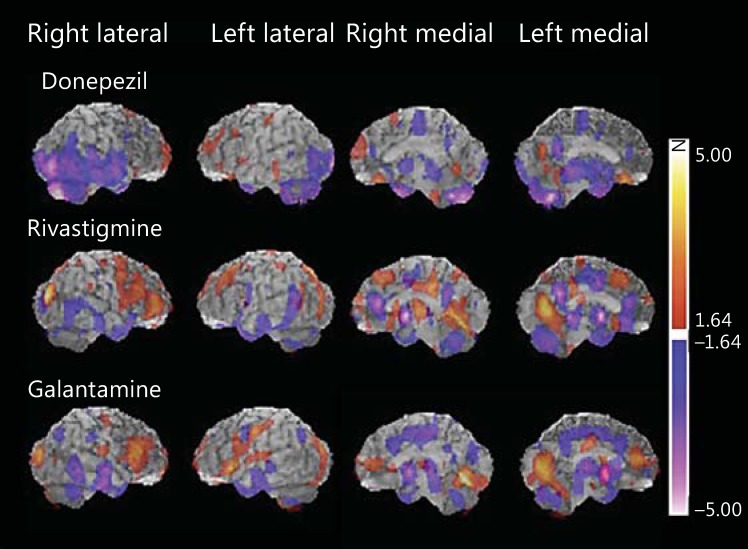
Fig. 3.
Statistical maps showing perfusion changes in the 3 treatment groups. Increased perfusion is indicated by ‘hot’ colors and decreased perfusion by ‘cold’ colors. All treatment groups showed a significant increase in rCBF mainly in the frontal lobe. A significant reduction in rCBF was observed in the temporal lobe and cingulate gyrus of all treatment groups.

