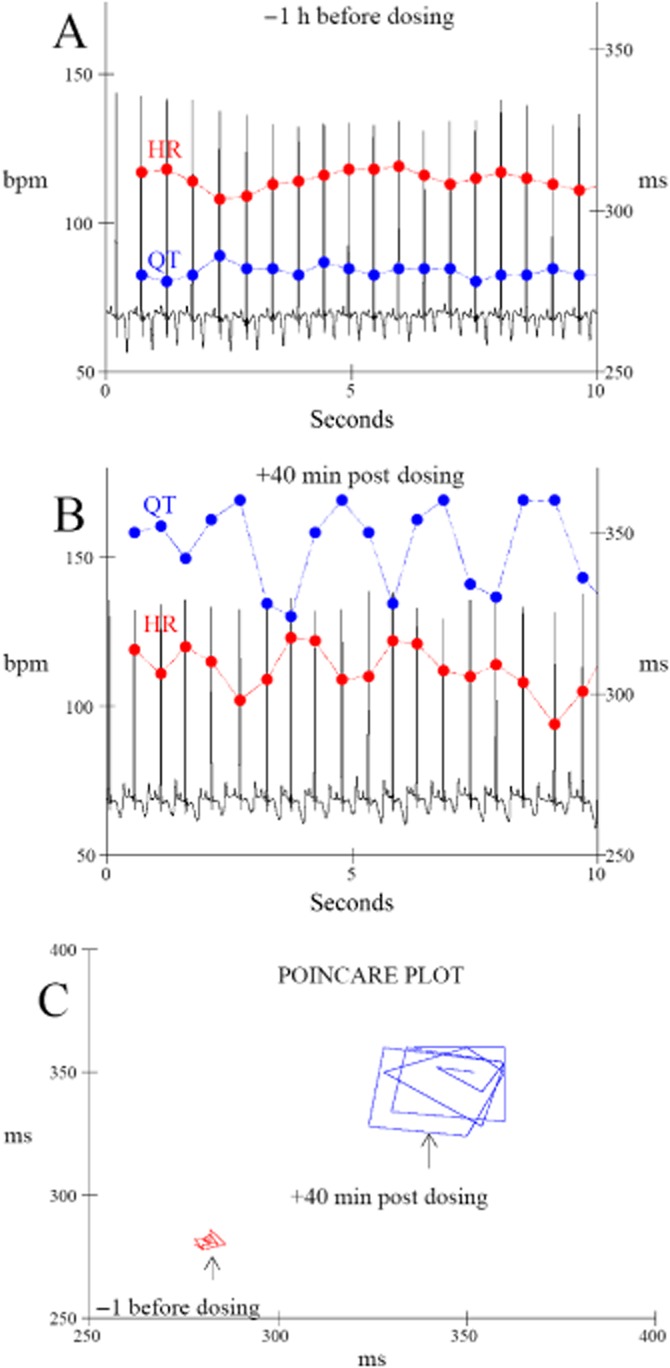
Figure 1.

Typical beat-to-beat HR and QT interval variability over a 10 s period recorded in the same cynomolgus monkey 1 h before (A) and 40 min after dosing with dofetilide (B, 1 mg·kg−1, p.o.). (C) The corresponding Poincaré plot (QTn+1 vs. previous QTn) showing an increase in beat-to-beat QT interval variability after dosing with dofetilide.
