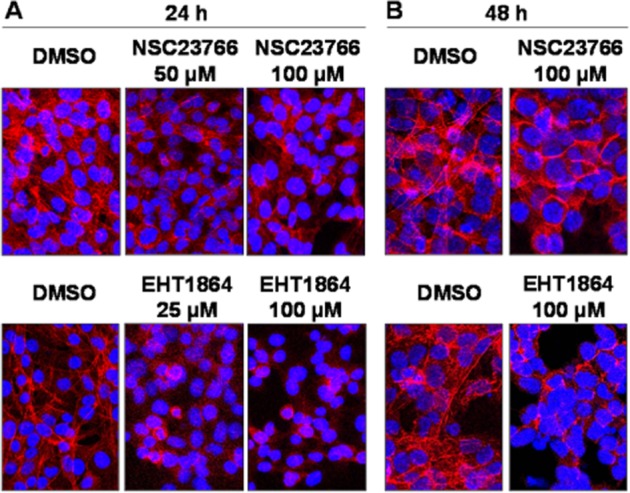
Figure 6.

Phalloidin staining of WPMY-1 cells. Cells were treated with different concentrations of NSC23766 (50, 100 μM) or EHT1864 (25, 100 μM), or solvent (DMSO) for different periods (24 or 48 h), and subsequently stained with FITC-labelled phalloidin (red fluorescence) and DAPI (blue fluorescence). Shown are representative stainings from three independent experiments.
