
Figure 4. SDS-PAGE analysis of VHH T7 biotinylated in vivo and/or in vitro.
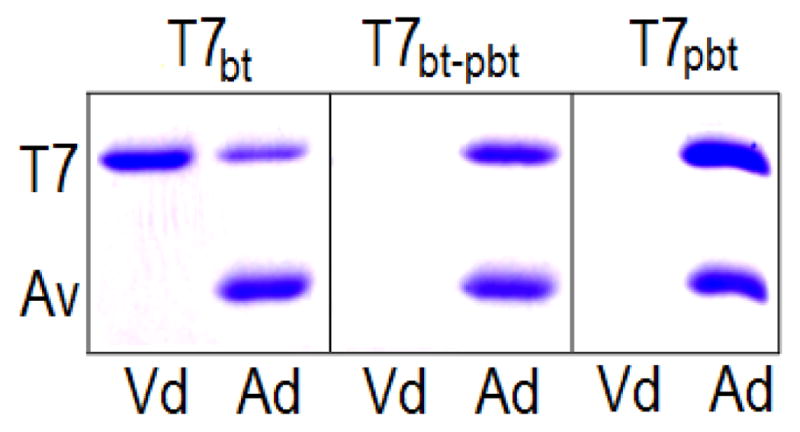
T7bt: T7 biotinylated in vivo; T7bt-pbt: prepared as T7bt, but the cell extract was further “post-biotinylated” by incubation with 100 μM biotin, 30 min, 37°C. T7pbt: T7 was co-express with BirA, but biotin (100 μM) was only added during the incubation of the cell extract. In all cases VHH T7 was purified on Ni-NTA-agarose, and was then applied to avidin-agarose spin columns; Vd, void; Ad, bound fraction eluted with SDS-PAGE sample buffer. The upper (T7) and lower (Av) bands correspond to the VHH, and the avidin monomer that is released from the avidin-agarose.