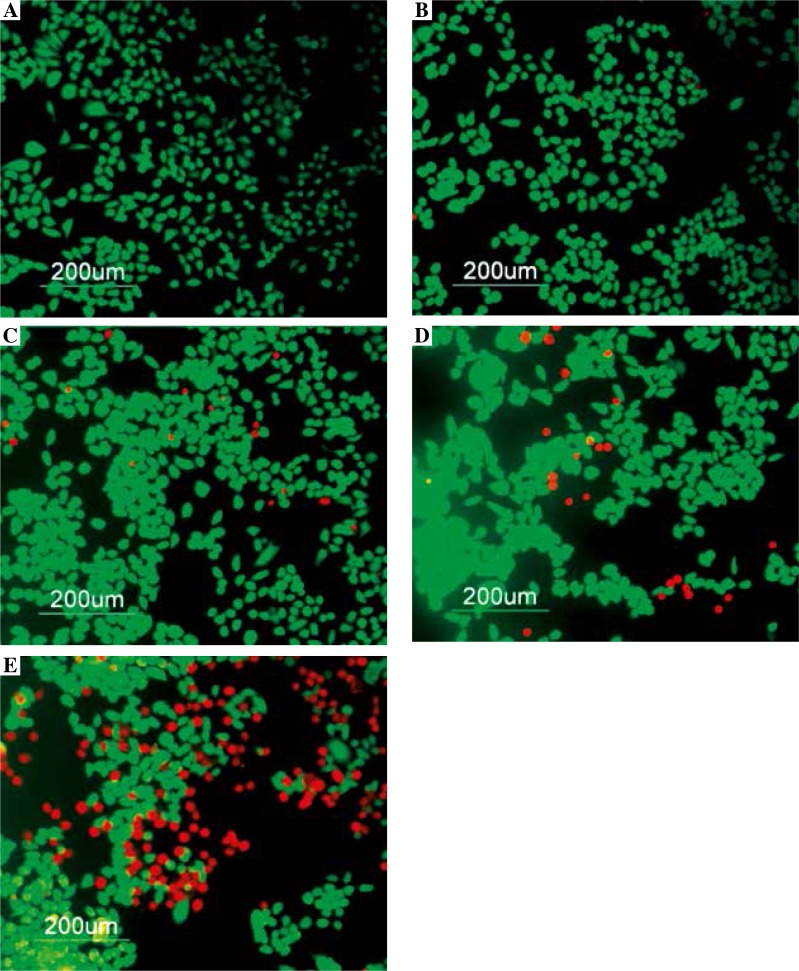
Fig. 2.
Fluorescent images of cultured SGC-7901 cells following FDA-PI staining. Cells were exposed to different concentrations of sufentanil for 24 h, then stained with FDA (green fluorescence) and PI (red fluorescence): A) control, B) 0.5 nM, C) 5 nM, D) 50 nM and E) 500 nM sufentanil. Bar = 200 μm

