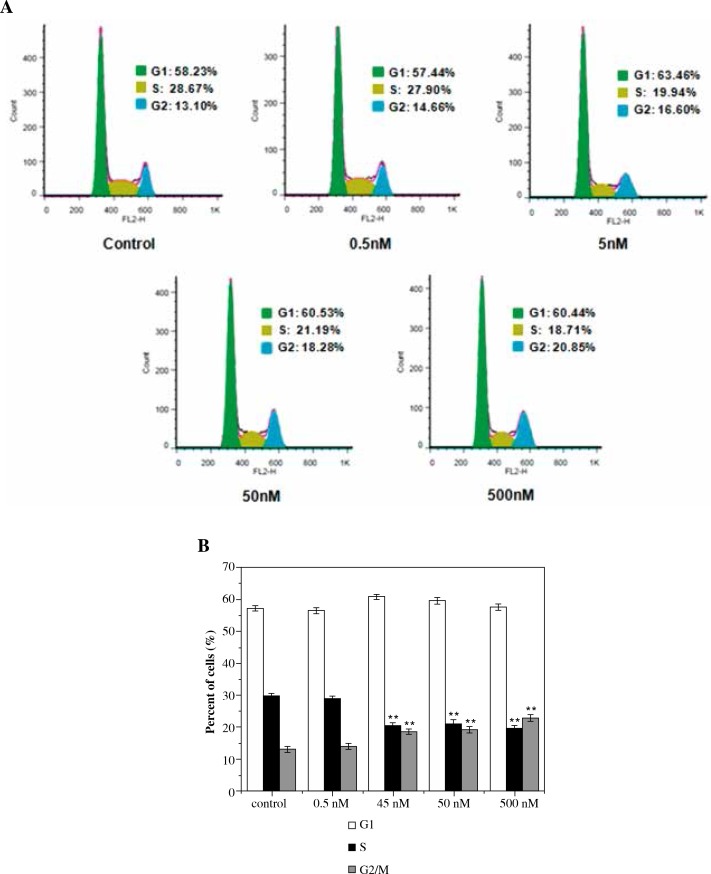
Fig. 4.
A) Cell cycle analysis of SGC-7901 cells treated with different concentrations of sufentanil for 24 h. Phases of G1, S and G2 are displayed by three different colors in each chart. B) Percents of SGC-7901 gastric cancer cells in G1, S and G2 phase respectively after being treated with different concentrations of sufentanil for 24 h. Data are shown as mean ± S.E. (n = 3). Asterisk denotes a response that is significantly different from the control (* p < 0.05, ** p < 0.01)

